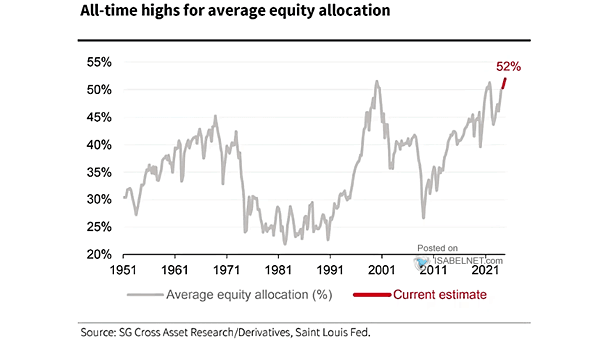
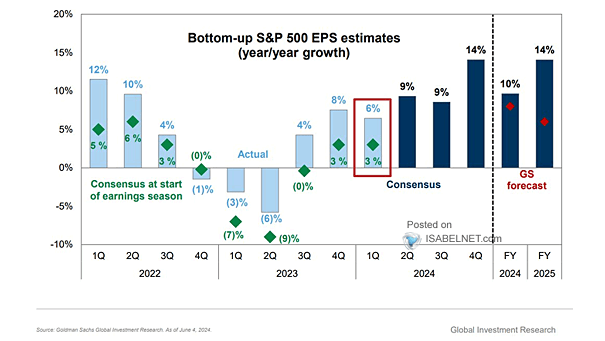
How Often Does a Correction Turn into a Bear Market?

How Often Does a Correction Turn into a Bear Market? Historically, a 10% correction rarely leads to a 20% bear market without economic downturns, earnings declines, or rate hikes. With no very serious adverse indicators…

ISABELNET Cartoon of the Day

ISABELNET Cartoon of the Day As U.S. stocks tumble, bears are writing eulogies for the market. Bulls, on the other hand, are buying the dip like there’s no tomorrow, which is ironically what bears foresee!…

Average Year for the S&P 500 the Past 20 Years

Average Year for the S&P 500 the Past 20 Years Bulls have reason to smile, as March 12 has marked notable market bottoms for U.S. stocks over the past two decades, and from that point,…

ISABELNET Cartoon of the Day

ISABELNET Cartoon of the Day February’s CPI inflation drops to 2.8%, beating the 2.9% forecast. On CPI days, bulls are like kids in a candy store, while bears sit in the corner, sulking like they…

Inflation – U.S. 10-Year Breakeven Rate

Inflation – U.S. 10-Year Breakeven Rate The declining U.S. 10-year breakeven inflation rate indicates that market participants expect inflation to moderate, aligning with the Fed’s 2% long-term target. Image: The Daily Shot

ISABELNET Cartoon of the Day

ISABELNET Cartoon of the Day Wall Street bears believe every bull market is just a bear market in disguise. When the crash comes, they can’t resist saying, “We knew it all along!” Happy “Hump” Day,…

S&P 500 Market Capitalization vs. U.S. GDP

S&P 500 Market Capitalization vs. U.S. GDP The wealth creation in the U.S. stock market has significantly outpaced the broader economy, leading to increased sensitivity of consumer spending to equity moves. Image: Bloomberg

ISABELNET Cartoon of the Day

ISABELNET Cartoon of the Day With the S&P 500 down year-to-date, it’s clear bulls need a little encouragement—let’s bring back their mojo and “Make Bulls Great Again!” Have a Great Day, Everyone! 😎