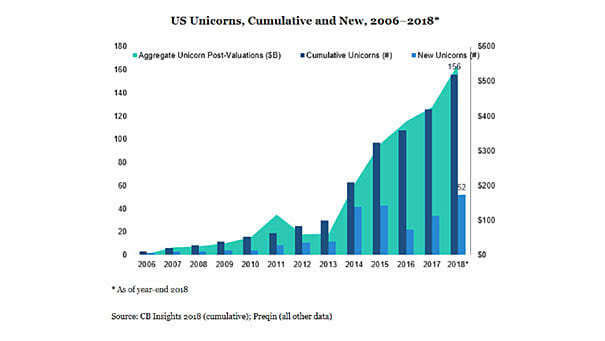
In Recent Years The Number of Unicorns Has Simply Exploded
In Recent Years The Number of Unicorns Has Simply Exploded Artificially low interest rates have caused a bubble in the sector. But how sustainable it is? Only time will tell.
In Recent Years The Number of Unicorns Has Simply Exploded Artificially low interest rates have caused a bubble in the sector. But how sustainable it is? Only time will tell.
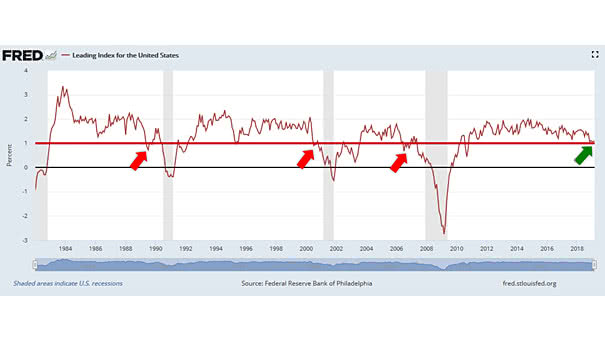
Are We Near a Recession? “The leading index for each state predicts the six-month growth rate of the state’s coincident index. In addition to the coincident index, the models include other variables that lead the…

When Is the Next Recession Coming? If history helps us to predict the future, a recession can occur when: Wage Growth minus Fed Funds Rate is below -1%. Why? Because the Fed is too tight…
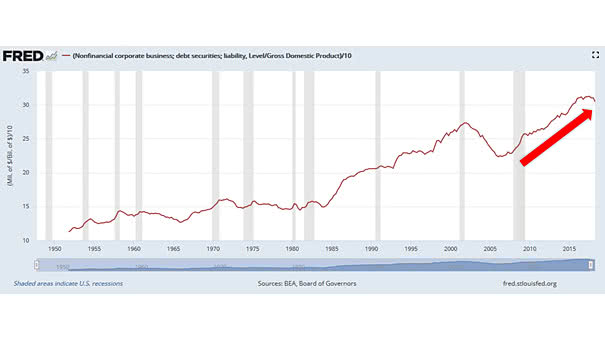
Why Are Dividends and Buybacks Hitting Record Highs? Corporate stock buybacks and dividends are booming, thanks to the tax cuts and low interest rates.Unfortunately, artificially low interest rates are associated with unnecessary debt and a…

Warren Buffett Talks Investment Strategy and Mastering the Market “Well, I look at a lot of figures just in connection with our businesses. I like to get numbers. So I’m getting reports in weekly in…
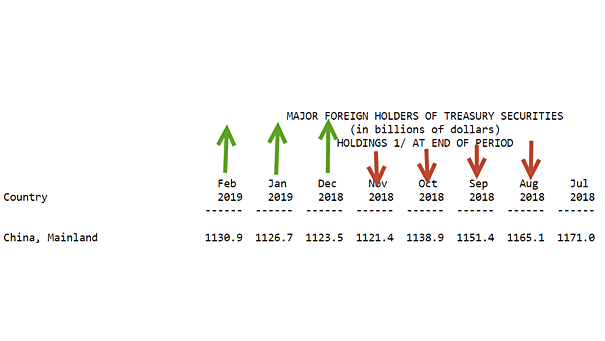
Are US-China Trade Talks “Going Very Well” As Donald Trump Says? Well, in 2018, China was selling its US Treasury securities. In 2019, it’s just the opposite. Not bad! Why? It is not obvious, but China…
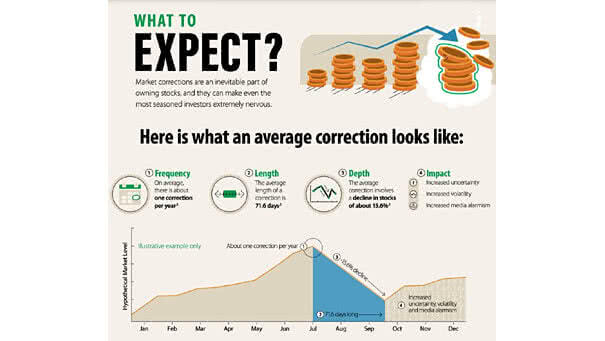
What An Average Stock Market Correction Looks Like? Stock market corrections are normal. On average, there is one correction per year, during 71.6 days and a decline in stocks of about 15.6% Image: Visual Capitalist

Investing Like Sheep (w/ Jeff Gundlach) | Future Fears “People want to be told what to think. I don’t! People need to listen with the mind as well as their ears, and not just repeat…
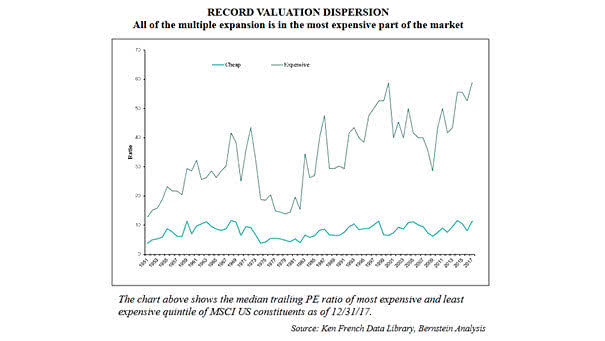
Record Valuation Dispersion 1951-2017 Today, there’s an extreme valuation divergence. The crowd invests in the most expensive part of the market. And the Value vs. Growth differential has never been so extreme, even during the…
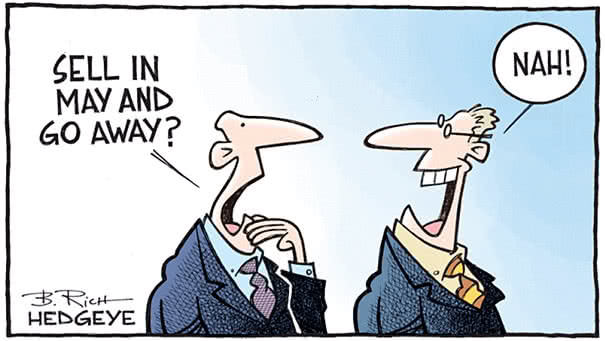
Sell in May and Go Away? Just keep in mind that 2013, 2014, 2015, 2016, 2017 and 2018 were positive in May. Image: Hedgeye Risk Management LLC
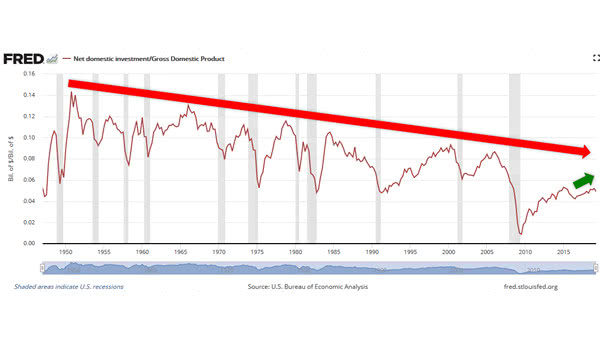
Why the Fed Can’t Raise Interest Rates Above Inflation Rate, Today? The Federal Reserve can’t raise the Fed funds rate above the inflation rate because the US productivity growth is too weak.Net Domestic Investment to…