Recession Length and Real Interest Rate at Time of Yield Curve Inversion
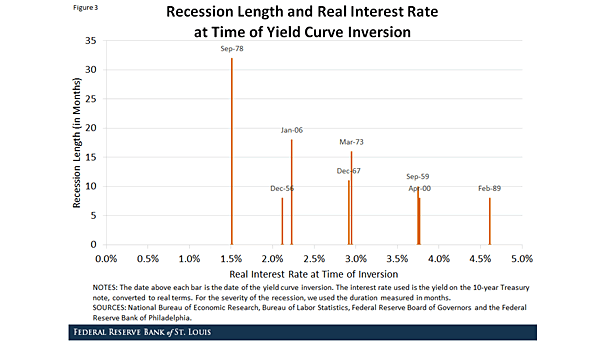
Recession Length and Real Interest Rate at Time of Yield Curve Inversion This chart shows the recession length and real interest rate at time of yield curve Inversion. Looking at real interest rates can provide…