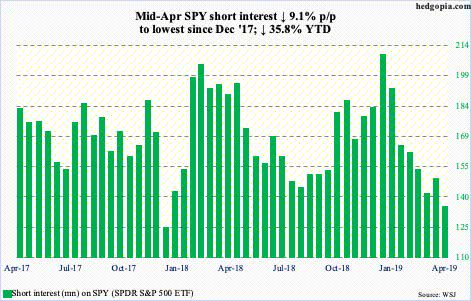
U.S. Total Federal Debt to GDP

U.S. Total Federal Debt to GDP Another interesting chart showing the U.S. total federal debt to GDP since 1791. The current federal debt to GDP is near an all-time high. Image: Bianco Research

The U.S. Federal Deficit

The U.S. Federal Deficit This chart shows how the U.S. federal deficit is skyrocketing. This is not a cause for panic… yet. Picture Source: Bianco Research

Detecting and Measuring Asset Bubbles

Detecting and Measuring Asset Bubbles Detecting and measuring asset bubbles is not always an easy task. This chart puts into perspective the current U.S. households financial assets to GDP and the U.S. federal debt as percentage…

S&P 500 and U.S. Economic Surprises

S&P 500 and U.S. Economic Surprises This chart shows the current divergence between the S&P 500 YoY and the 12-month moving average of the U.S. economic surprise index. Image: Oxford Economics and Macrobond

Investor Allocation by Region in the U.S.

Investor Allocation by Region in the U.S. This chart is a good example of investment bias and shows the likelihood of owning stocks in an industry vs. national average. Picture Source: J.P. Morgan Asset Management

Time, Diversification and the Volatility of Returns

Time, Diversification and the Volatility of Returns This chart shows how the volatility of returns decreases over time (range of equity, bond and blended total return). Picture Source: J.P. Morgan Asset Management