S&P 500 Returns After a Three Month Gain of >25%
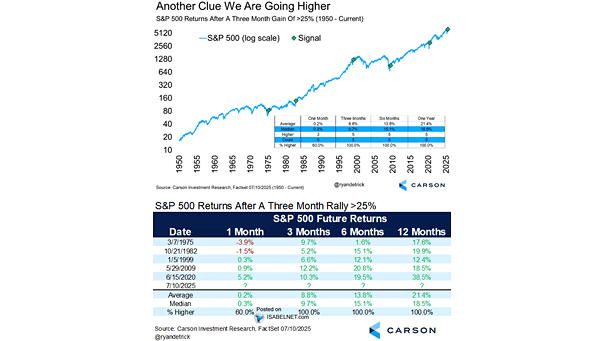
S&P 500 Returns After a Three Month Gain of >25% More good news for bulls: Historically, when the S&P 500 has risen more than 25% over three months, it has never been lower 3, 6,…
S&P 500 Returns After a Three Month Gain of >25% More good news for bulls: Historically, when the S&P 500 has risen more than 25% over three months, it has never been lower 3, 6,…
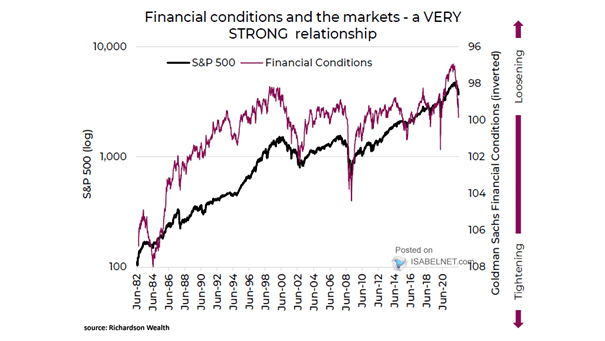
Financial Conditions Indices Looser U.S. financial conditions bode well for economic growth by fueling consumer spending and business investment—two vital engines driving the economy forward. Image: Goldman Sachs Global Investment Research
S&P 500 RSI With the S&P 500’s RSI running high, caution is warranted. Market participants should be ready for a potential pullback or a period of consolidation as the market digests overbought levels before pushing…
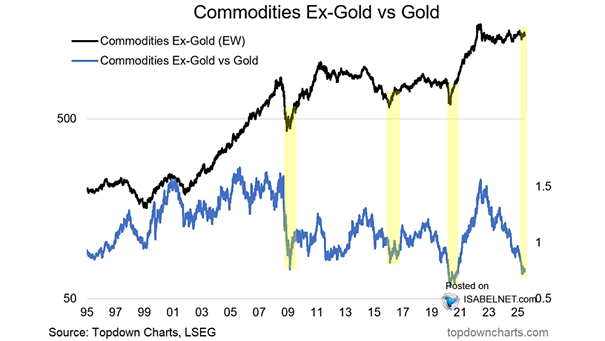
Commodities Ex-Gold vs. Gold When the commodities (ex-gold) to gold ratio falls to an extreme low and then turns upward, it has historically signaled the beginning of major cyclical bull markets in commodities. Image: Topdown…
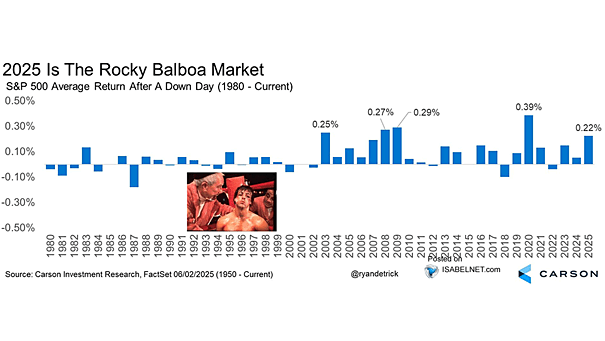
S&P 500 Average Return After a Down Day The year 2025 stands out for the S&P 500, especially because of its resilience following daily declines. Since January, it has rebounded by an average of 0.32%…
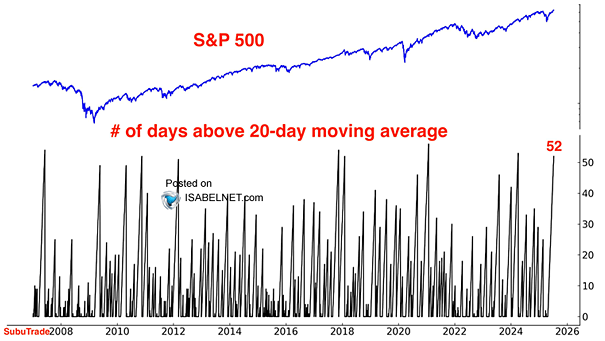
S&P 500 and Number of Days Above 20-Day Moving Average While the S&P 500’s extended period above its 20-day moving average signals strong momentum, historical patterns and technical indicators point to a potential pullback or…
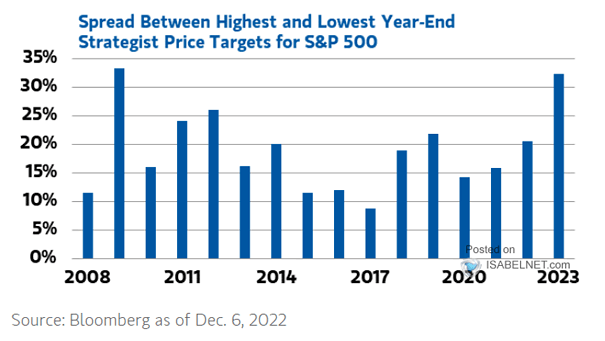
Distribution of Strategist Forecats for S&P 500 Year-End 2025 Index Level Goldman Sachs’ 6600 year-end target for the S&P 500 reflects a confident view on the market’s trajectory, driven by expected Fed easing and strong…
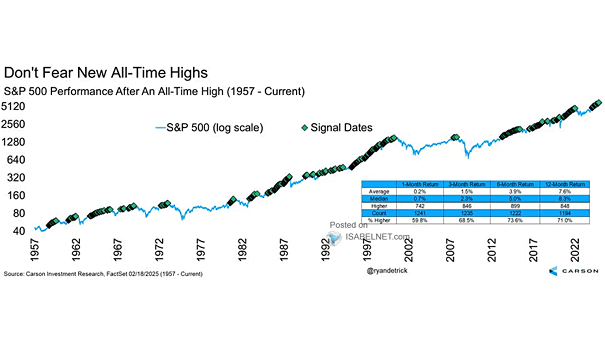
S&P 500 Returns After New All-Time Highs Since 1990, despite periods of volatility, the S&P 500 has typically continued rising after new all-time highs, with a median 12-month gain of 13.5% and positive returns more…
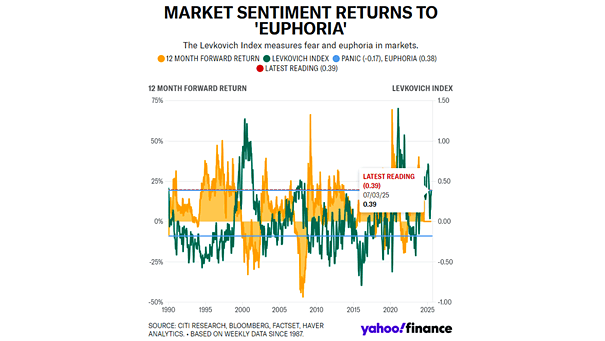
Market Sentiment – Levkovich Index The Levkovich Index, or Panic/Euphoria Model, is currently at “euphoria,” indicating strong investor optimism. This often serves as a contrarian signal that equities may face downward pressure over the next…
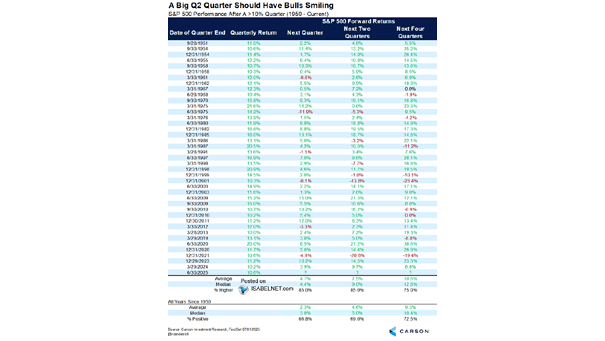
S&P 500 Performance After a >10% Quarter Since 1950, when a quarter’s return exceeds 10%, the next quarter typically performs better than average—gaining 4.7% on average compared to the overall average of 2.3%, and posting…
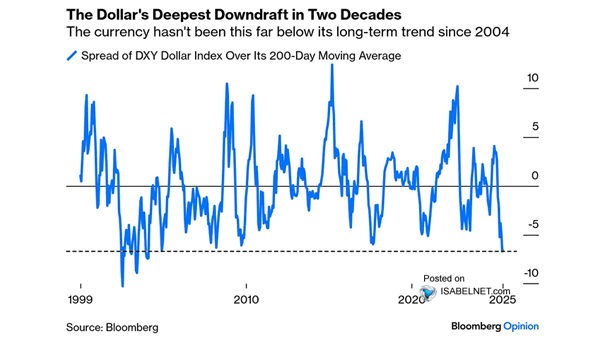
U.S. Dollar and 200-Day Moving Average The DXY dollar’s current position well below its 200-day moving average marks a rare bearish phase, the likes of which have not been seen in two decades, signaling a…