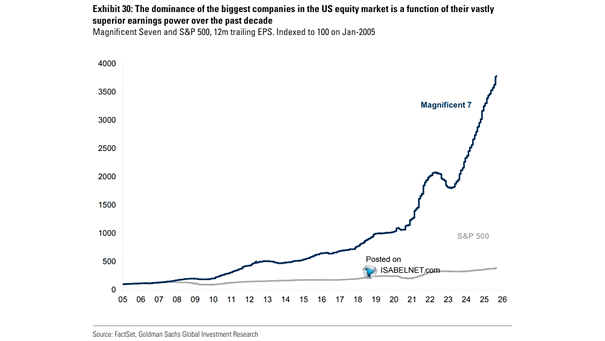
U.S. 10-Year Treasury Term Premium

U.S. 10-Year Treasury Term Premium The increasing term premium signals that investors require greater compensation for the risks inherent in holding longer-term bonds, reflecting increased concerns about interest rate and inflation over longer durations. Image:…

U.S. Dollar vs. Gold – Share in Global Reserves

U.S. Dollar vs. Gold – Share in Global Reserves As countries and central banks seek to reduce their reliance on the U.S. dollar for reserves and international trade, gold has emerged as the preferred alternative…

Trade Weighted Dollar vs. U.S. Inflation Surprises

Trade Weighted Dollar vs. U.S. Inflation Surprises Since February 2025, the U.S. dollar has closely tracked inflation surprises, as both headline and core inflation came in lower than expected, reflecting Fed policy expectations and concerns…

S&P 500 Recovery

S&P 500 Recovery In just over two months, the post-“Liberation Day” recovery in the S&P 500 is the strongest and fastest on record, surpassing any rebound seen in the last 75 years. Image: Deutsche Bank…

Sahm Rule Recession Indicator – U.S. Unemployment Rate

Sahm Rule Recession Indicator – U.S. Unemployment Rate A drop in the Sahm Rule indicator below 0.5 is a positive sign, as it suggests the rule is not currently signaling a U.S. recession—a generally reassuring…

S&P 500 Returns – Strong vs. Weak Periods

S&P 500 Returns – Strong vs. Weak Periods U.S. stock market returns do tend to be weaker on average during the summer months (May–October) compared to the winter months (November–April). However, investors should consider seasonality…

U.S. Airplane Traffic and Economic Growth

U.S. Airplane Traffic and Economic Growth A year-over-year decline in U.S. air passenger traffic is a reliable early warning of economic trouble. When uncertainty rises, people and businesses tend to defer travel, which usually bodes…

S&P 500 After Two Month Gains of 20% or More

S&P 500 After Two Month Gains of 20% or More More good news for bulls: Historically, after a two-month gain of over 20%, the S&P 500 has never been lower 1, 3, 6, or 12…

Risk Parity Model Portfolio Weights

Risk Parity Model Portfolio Weights In risk-parity strategies, the current equity allocation is at the 8th percentile—well below the median—reflecting a preference for safer assets despite the ongoing equity rally. Image: Deutsche Bank Asset Allocation