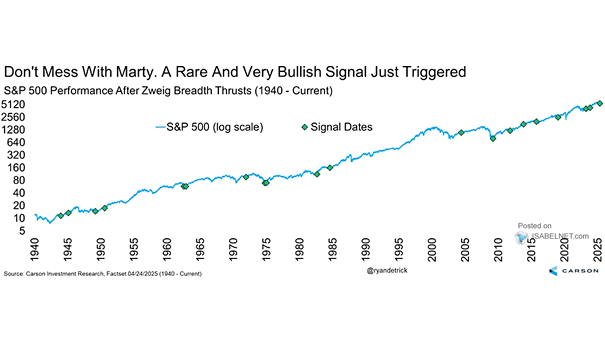
S&P 500 and Zweig Breadth Thrust
S&P 500 and Zweig Breadth Thrust Bulls have reason to smile as the Zweig Breadth Thrust has perfectly predicted S&P 500 gains in all 19 post-WWII instances, averaging 23.4% returns within a year and never…
S&P 500 and Zweig Breadth Thrust Bulls have reason to smile as the Zweig Breadth Thrust has perfectly predicted S&P 500 gains in all 19 post-WWII instances, averaging 23.4% returns within a year and never…
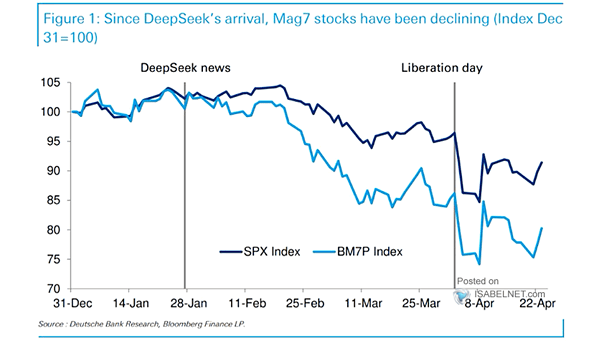
Magnificent Seven Stocks vs. S&P 500 Index Since DeepSeek’s emergence in January 2025, the Magnificent Seven stocks have underperformed compared to the S&P 500, driven by AI disruption fears and concerns over capital expenditures. Image:…

ISABELNET Cartoon of the Day While bulls are toasting the S&P 500 gains this week, bears are busy Googling “emergency exits from a market rally.” Happy Friday, Everyone! 😎
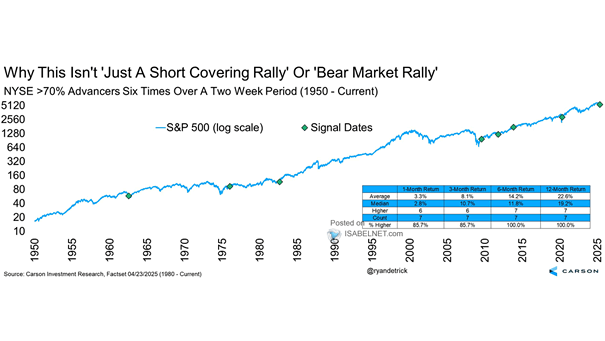
S&P 500 and NYSE >70% Advancers Six Times Over a Two Weeks Period Six trading days with NYSE advancers exceeding 70% within a two-week period historically signal a robust bullish phase—distinct from bear-market rallies—with an…
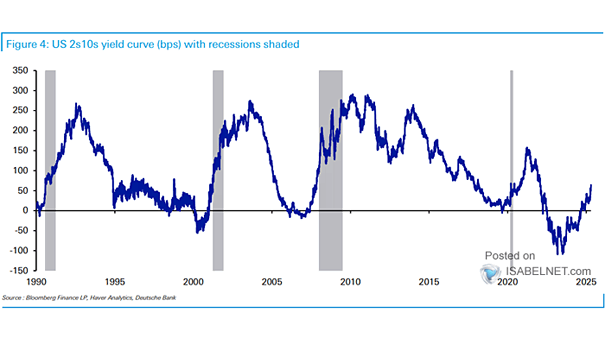
U.S. 10Y-2Y Yield Curve While a steepening inverted yield curve has historically warned of recession, persistent economic strength could mean a more positive outlook for U.S. equities in 2025—though this would mark a notable break…
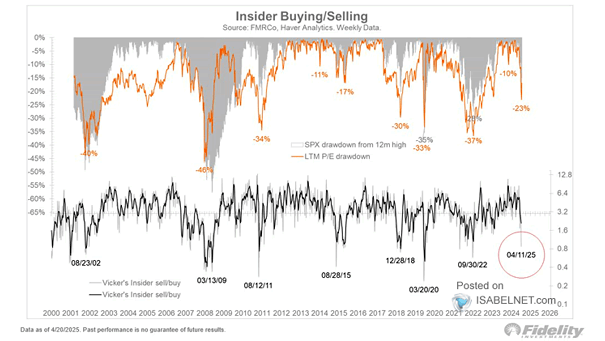
S&P 500 Drawdown and Insider Buying/Selling The Vickers insider sell/buy ratio, which tracks corporate insider transactions, indicates insiders perceive value at current price levels—a trend historically viewed as a bullish signal for market direction. Image:…
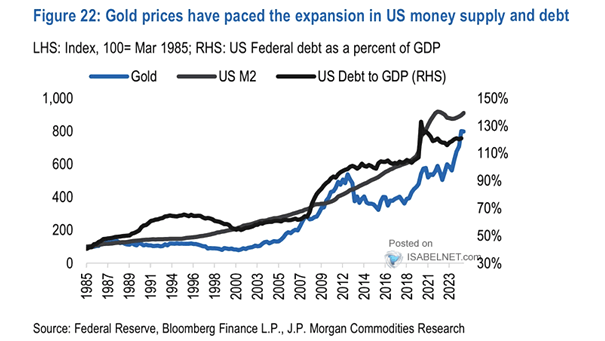
Gold vs. U.S. M2 and U.S. Debt to GDP Historically, gold prices have tracked the expansion of the money supply and have responded to increases in U.S. government debt. Image: J.P. Morgan Commodities Research

ISABELNET Cartoon of the Day Bulls are confident that the bull market in 2025 is as secure as a dog with a bone—stay ready for surprises! Have a Great Day, Everyone! 😎
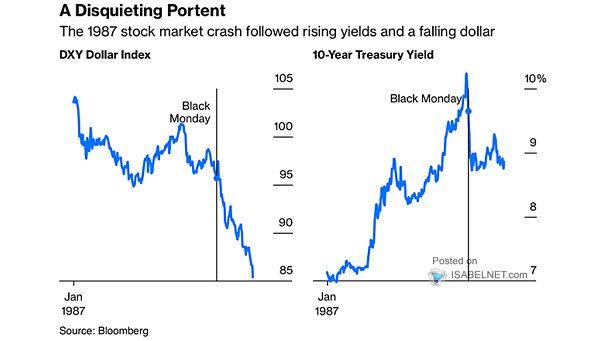
1987 Market Crash – DXY Dollar Index and 10-Year UST Yield Bond yields rarely rise while the dollar falls, as higher yields usually boost currency appeal. This unusual trend signals waning confidence, similar to the…
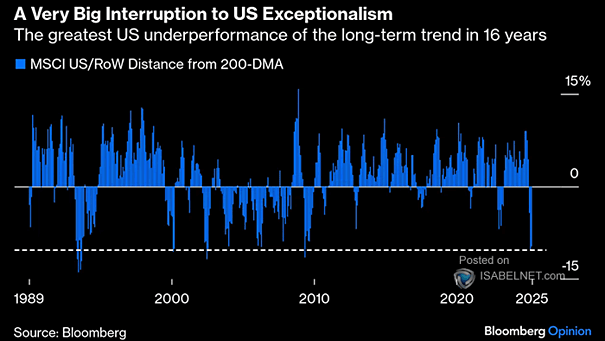
Equities – MSCI U.S./RoW Distance from 200-DMA The MSCI U.S./RoW distance from the 200-DMA highlights a major interruption to the narrative of U.S. exceptionalism and reinforces the need for global diversification in equity portfolios. Image:…
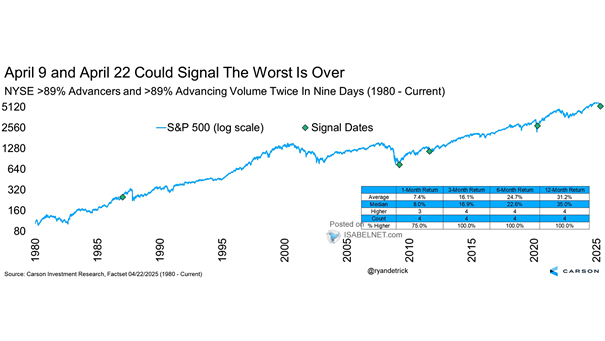
S&P 500 and NYSE >89% Advancers and >89% Advancing Volume in Nine Days A rare event—over 89% of NYSE stocks and volume advancing twice in nine days—has historically signaled strong bullish momentum. Since 1980, the…