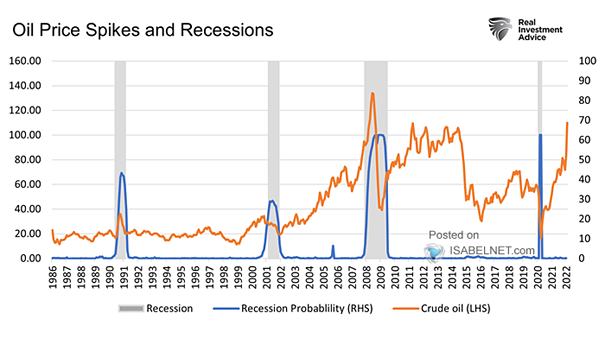
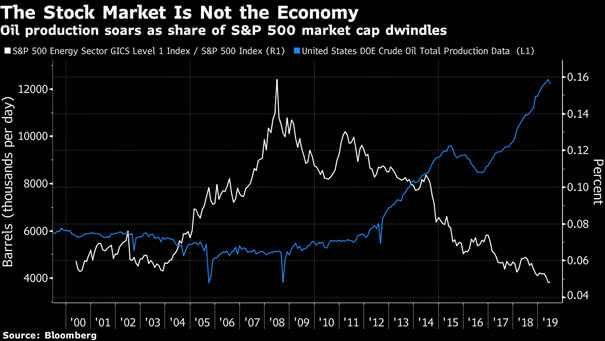
S&P 500 Performance by Month

S&P 500 Performance by Month It is challenging to predict how U.S. stocks will perform in any specific month, but September is historically known to be a volatile month. Image: Yahoo Finance

Cumulative Tech Flows

Cumulative Tech Flows Will investors’ love of tech stocks continue? Image: BofA Global Investment Strategy

Average of Straddle Buying Returns

Average of Straddle Buying Returns Buying straddles into earnings is a popular speculative tactic for trading stock volatility, which has proven to be a successful strategy thus far in 2023. Image: Goldman Sachs Global Investment…

S&P 500 Advance-Decline Line

S&P 500 Advance-Decline Line The bullish retest of the breakout to new all-time highs for S&P 500 advance-decline in June is very good news for the U.S. stock market. Image: BofA Global Research

S&P 500 Daily % Change

S&P 500 Daily % Change Typically, the best days in the U.S. stock market often come after the worst days. Investors usually observe clusters of the S&P 500’s largest percentage gains during challenging periods. Image:…

Average of Analyst Day Stock Performance

Average of Analyst Day Stock Performance The stock performance during analyst days in 2023 has generally been positive, with an average increase of 0.2% year-to-date. Image: Goldman Sachs Global Investment Research