Money Market Fund Assets
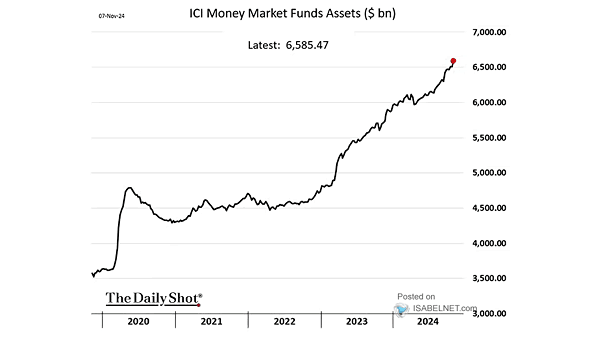
Money Market Fund Assets While the $7 trillion in money market funds is frequently cited as potential fuel for equities and risk assets, most evidence suggests this cash is primarily a result of yield optimization…
Money Market Fund Assets While the $7 trillion in money market funds is frequently cited as potential fuel for equities and risk assets, most evidence suggests this cash is primarily a result of yield optimization…
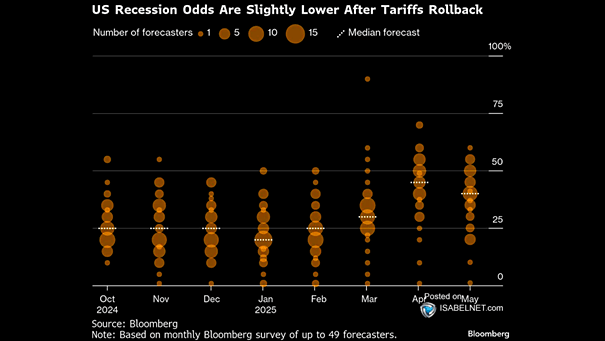
U.S. Recession Odds A Bloomberg survey in May 2025 puts the likelihood of a U.S. downturn in the next year at 40%—a drop from 45% in April, but still considerably higher than the 30% forecast…
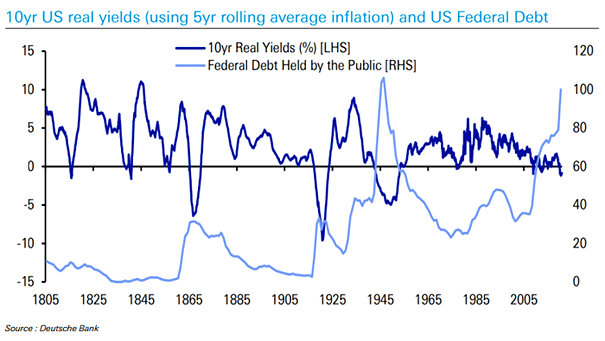
U.S. 10-Year Treasury Yield and U.S. Federal Debt Held by the Public Even with U.S. federal debt at historic highs and projected to rise further, the 10-year U.S. Treasury yield remains low compared to the…
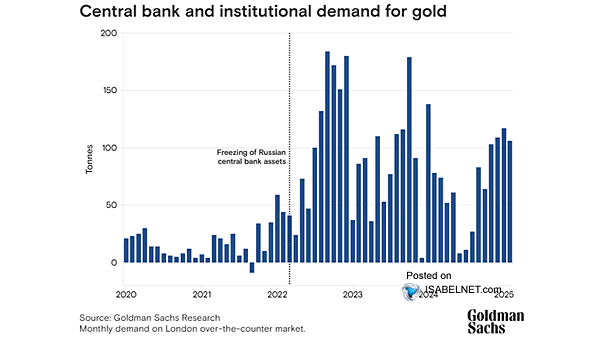
Central Bank and Institutional Demand for Gold Goldman Sachs expects ongoing strong demand from central banks—especially those in emerging markets—to continue boosting gold prices through 2025. Central bank gold purchases have risen fivefold since 2022.…
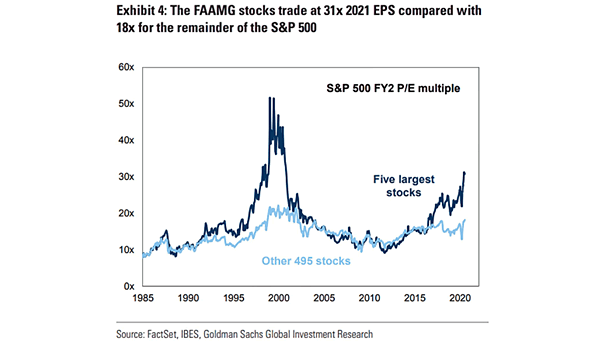
Valuation – S&P 500 Company Actual vs. Modeled FY2 P/E Ratio Valuations for the Magnificent Seven now sit slightly below modeled fair value, especially in light of their robust fundamentals and earnings growth. Image: Goldman…
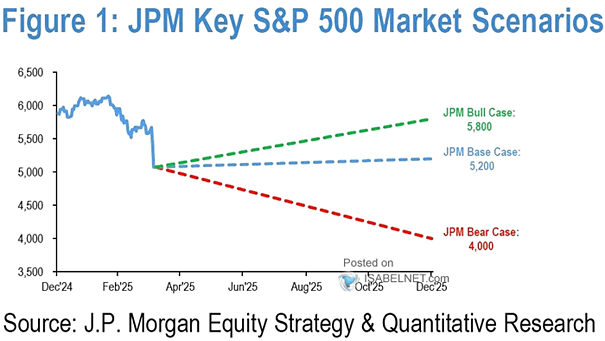
S&P 500 Target for 2025 In the coming months, robust earnings, a weaker dollar, anticipated Fed rate cuts, and easing recession fears are expected to make U.S. equities a key driver of the global equity…
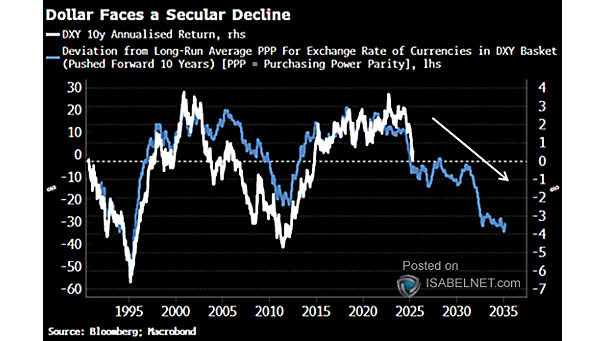
U.S. Dollar DXY Index Deviation from PPP Fair Value and Subsequent 10-Year Annualized Return By most measures, the U.S. dollar remains overvalued-even after its recent declines-and appears poised for a secular decline. Image: Bloomberg
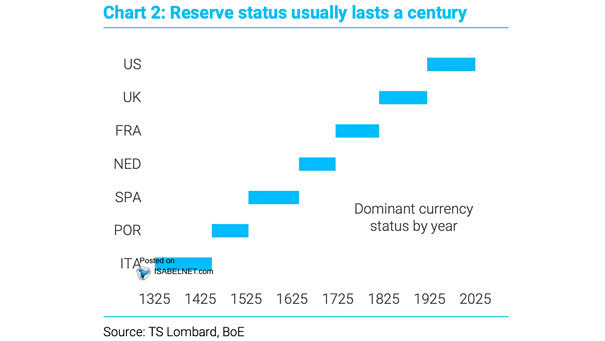
The U.S. Dollar and Reserve Status Could the U.S. dollar lose its status as the world’s dominant reserve currency? Historically, leading reserve currencies have held their status for about a hundred years. Image: TS Lombard
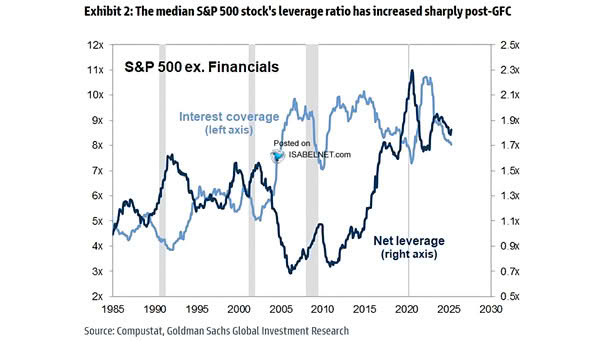
S&P 500 Ex. Financials – Net Leverage and Interest Coverage Since the Global Financial Crisis, there has been a sharp increase in the median S&P 500 stock’s leverage ratio, a trend that could have substantial…
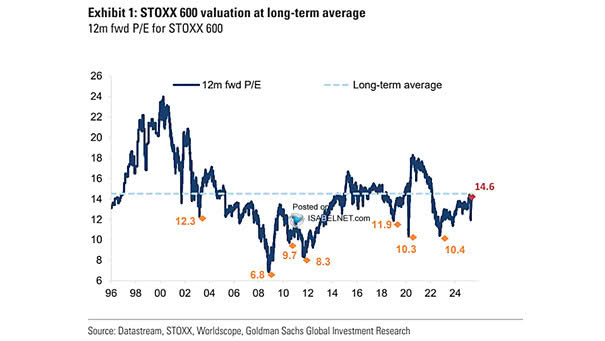
Valuation – 12-Month Forward STOXX Europe 600 PE European stocks look less expensive than at the beginning of this year. Image: Goldman Sachs Global Investment Research
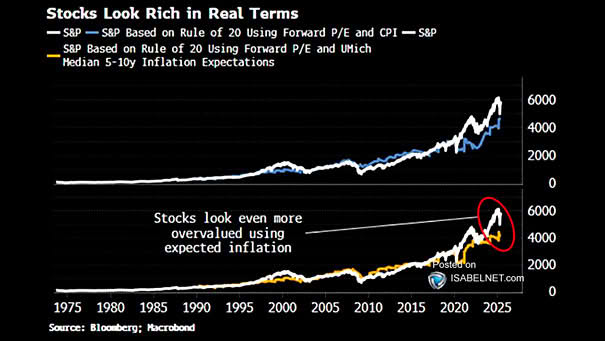
Valuation – S&P 500 Based on Rule of 20 According to the historically reliable “Rule of 20,” the market is fairly valued when the P/E ratio plus the inflation rate equals 20. By this measure,…