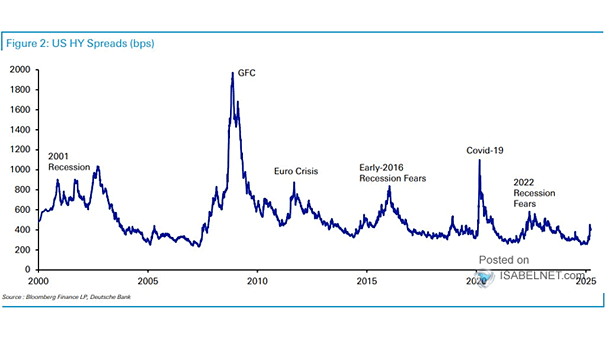
Equities – MSCI U.S./RoW Distance from 200-DMA

Equities – MSCI U.S./RoW Distance from 200-DMA The MSCI U.S./RoW distance from the 200-DMA highlights a major interruption to the narrative of U.S. exceptionalism and reinforces the need for global diversification in equity portfolios. Image:…

ISABELNET Cartoon of the Day

ISABELNET Cartoon of the Day Wall Street bears are convinced the bull market is crazy, but bulls are too busy wearing noise-canceling headphones to hear any warnings. Happy “Hump” Day, Everyone! 🐫🐪😎

Dow Jones Industrial Average vs. Smart Money Flow Index

Dow Jones Industrial Average vs. Smart Money Flow Index The Smart Money Flow Index currently suggests that the most probable short-term direction for the U.S. stock market is upward. Image: Paulsen Perspectives

ISABELNET Cartoon of the Day

ISABELNET Cartoon of the Day When bulls sense a market boom, bears are quick to dismiss it, claiming there’s “nothing to see here.” Have a Great Day, Everyone! 😎

Consensus Earnings Estimates

Consensus Earnings Estimates Despite economic uncertainties and potential tariff impacts, downward revisions to 2025 EPS estimates have remained modest, underscoring their resilience. Image: J.P. Morgan Asset Management

Two-Day Returns for the S&P 500

Two-Day Returns for the S&P 500 The clustering of best and worst days underscores the importance of patience and discipline in investing. Selling after the worst days often means missing the best days that follow!…

ISABELNET Cartoon of the Day

ISABELNET Cartoon of the Day Even bulls and bears are calling a truce this Easter Monday—time to trade market chaos for chocolate eggs! Happy Easter Monday, Everyone!🐰😎

U.S. True Financial Conditions Index

U.S. True Financial Conditions Index The U.S. True Financial Conditions Index stands at 6, indicating a slightly accommodative financial environment. Image: Gavekal, Macrobond