GWIM Debt Holdings as % of AUM
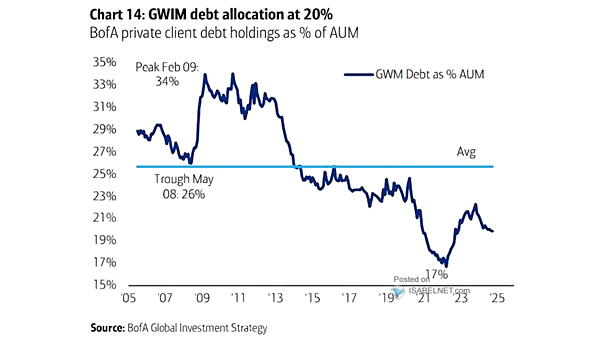
GWIM Debt Holdings as % of AUM Bank of America’s private clients maintain a low debt allocation of 20%, which remains significantly below the average level. Image: BofA Global Investment Strategy
GWIM Debt Holdings as % of AUM Bank of America’s private clients maintain a low debt allocation of 20%, which remains significantly below the average level. Image: BofA Global Investment Strategy
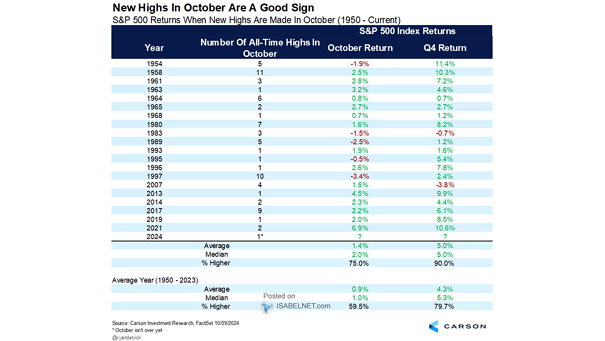
S&P 500 Returns When New Highs Are Made In October Bulls smile when new highs are made in October, as the fourth quarter has historically seen gains 90% of the time, averaging a 5% return…

S&P 500 Returns During Earnings Seasons Earnings season usually sees the S&P 500 rallying, with a median return of 2.0% in the first 4 weeks of reporting, driven by positive surprises in corporate earnings that…
S&P 500 Historical FY2 EPS Revisions vs. Consensus EPS Recent downward revisions in S&P 500 EPS estimates for 2024-25 reflect a cautious approach from analysts, primarily driven by economic uncertainties. Image: BofA US Equity &…
Spread Between BBB-Rated Corporate Bond Yield and 90-Day U.S. Treasury Bill Yield The recent increase in the spread between IG credit yield and cash yield marks a significant shift from a 43-year low. Should investors…
GWIM Cash Allocation as % Asset Under Management BofA’s private clients have reduced their cash allocation, remaining below the long-term average, while increasing their equity exposure. Image: BofA Global Investment Strategy
S&P 500 and U.S. 2s-10s Yield Curve Since the late 1950s, 10 of the last 12 yield curve steepening cycles have coincided with U.S. recessions, highlighting the yield curve’s effectiveness as a predictor of economic…
Corporate Client Buybacks as a % of S&P 500 Market Capitalization BofA’s corporate clients are currently engaging in significant stock buyback activities, marking an all-time high. This trend is generally perceived as a positive indicator…
Real Estate Positioning Real estate positioning at the 89th percentile indicates strong interest from market participants. Image: Deutsche Bank Asset Allocation
Market – Net Buys by Sector Last week, ETFs recorded the largest inflows, while the tech sector saw the largest outflows from BofA’s private clients. Image: BofA Securities
U.S. Labor Market – Nonfarm Payrolls Growth in the Month That the Fed Starts Easing Policy The recent rise in payroll numbers is surprising given the Fed’s easing of interest rates. Usually, strong job growth…