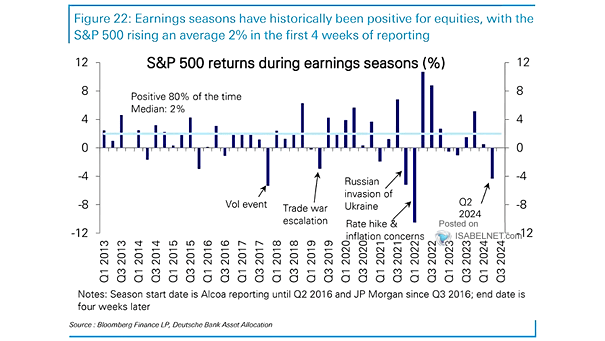
S&P 500 Returns During Earnings Seasons
S&P 500 Returns During Earnings Seasons Earnings season usually sees the S&P 500 rallying, with a median return of 2.0% in the first 4 weeks of reporting, driven by positive surprises in corporate earnings that…