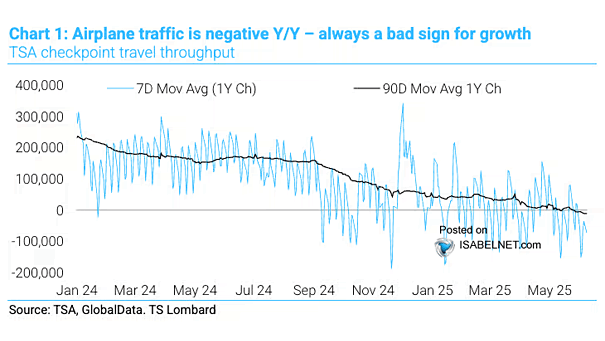
ISABELNET Cartoon of the Day
ISABELNET Cartoon of the Day With U.S. stocks down YTD, bears are busy penning eulogies for the market. Bulls, however, are buying the dip like it’s Black Friday—happier than kids in a candy store! Have…
Aggregated U.S. Equity Futures Positions and S&P 500 Relative to Its 200-DMA While leveraged funds and asset managers have slightly scaled back their bullish stance, they still maintain substantial net long positions in U.S. equity…
Median S&P 500 Stock Bid-Ask Spread Bid-ask spreads for S&P 500 stocks have widened significantly in recent trading sessions, driven by heightened market volatility and liquidity strains. Image: Goldman Sachs Global Investment Research
S&P 500 Corrections and Bear Markets Since World War II Corrections and bear markets, while inevitable and uncomfortable, often reset valuations—providing long-term investors a chance to reevaluate holdings and build positions at attractive levels. Image:…
AAII U.S. Investor Sentiment Bearish Readings > 50 The current AAII U.S. Investor Sentiment Bearish reading of 58.9% marks the 7th consecutive week above 50%, aligning with the record streak observed in October 1990, which…
Top 10 Companies’ Share of Market Capitalization China’s stock market concentration is moderately lower than that of the United States. Image: Goldman Sachs Global Investment Research
S&P 500 5% Gains and What Happened Next Since 1950, the S&P 500 has surged 5% or more in a single day on 23 occasions. A year later, stocks climbed an average of 26.9%, with…
MSCI AC World Calendar Year Returns vs. Intra-Year Declines Despite median intra-year drops of 15%, the global equity index ended positively in 34 of the past 45 years—highlighting the value of long-term investing over reacting…
MSCI AC World – Bear Market Rallies Since the 1980s, there have been 19 global bear market rallies, lasting 44 days on average with MSCI AC World returns of 10–15%. Image: Goldman Sachs Global Investment…
Valuation – Consensus Forward P/E vs. Expected EPS Growth The P/E premium reflects higher expected EPS growth, supported by a strong current correlation between EPS growth forecasts and P/E multiples. Image: Goldman Sachs Global Investment…
S&P 500 Daily % Range The S&P 500 surged 9.52% on Wednesday, its third-largest single-day gain since WWII, with an intraday range of 10.77%. Image: The Daily Shot