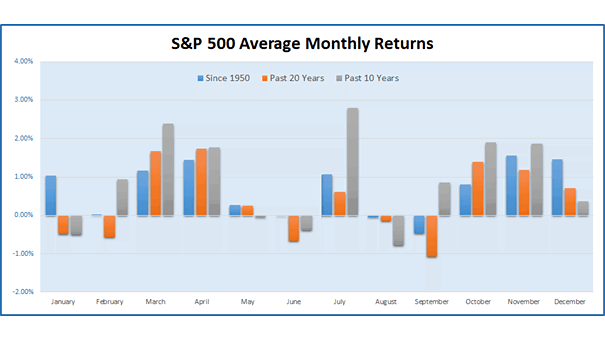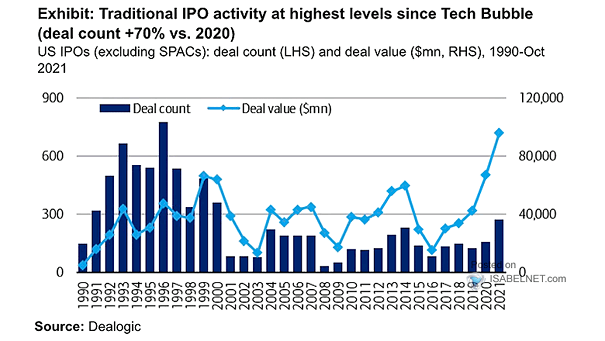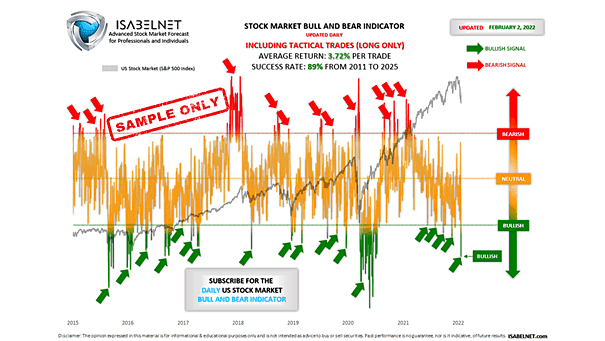
U.S. Stock Market Bull and Bear Indicator – S&P 500
U.S. Stock Market Bull and Bear Indicator – S&P 500 At last week Monday’s close, our Stock Market Bull & Bear Indicator was not bearish at all, and the S&P 500 followed through on Tuesday, closing up 0.89%. Using multiple financial data, this great model helps investors navigate through different market conditions. It suggests whether…