S&P 500 Valuations
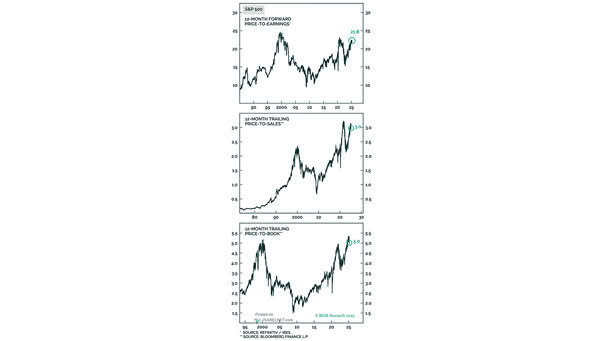
S&P 500 Valuations Despite recent declines, U.S. stocks are still expensive when compared to historical standards, raising concerns about future returns amid economic uncertainty. Image: BCA Research
S&P 500 Valuations Despite recent declines, U.S. stocks are still expensive when compared to historical standards, raising concerns about future returns amid economic uncertainty. Image: BCA Research

ISABELNET Cartoon of the Day March is like a bull’s worst nightmare—after the S&P 500 took a nosedive of 3.10% last week, bears threw a party that even bulls couldn’t crash, tossing confetti and gleefully shouting, “See? We told you it was coming!” Have a Great Week, Everyone! 😎
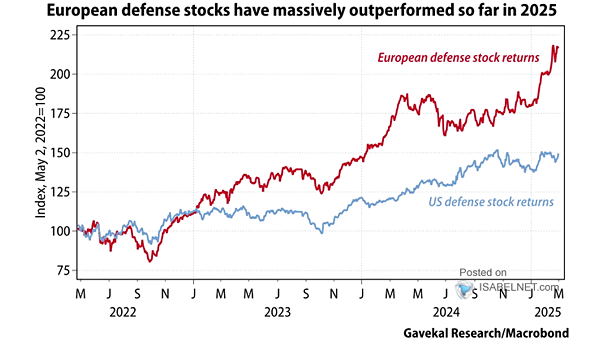
European Defense Stock Returns vs. U.S. Defense Stock Returns The trend of European defense stocks outperforming U.S. peers is likely to persist in the medium term due to sustained increases in military spending and geopolitical realignments favoring local suppliers. Image: Gavekal, Macrobond
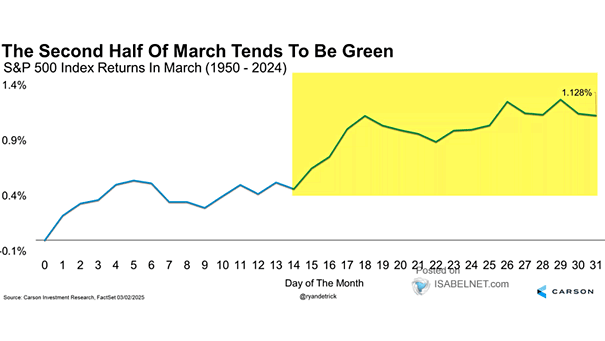
Seasonality – S&P 500 Returns in March Since 1950, the second half of March has tended to be favorable for U.S. stocks. This historical pattern, combined with the fact that March marks the end of the first quarter, gives bulls reasons to be optimistic. Image: Carson Investment Research
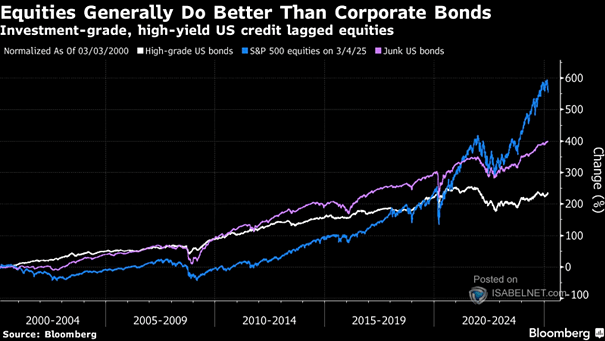
S&P 500 vs. High-Grade U.S. Bonds vs. Junk U.S. Bonds While U.S. stocks generally have higher long-term returns, the current economic climate may favor junk U.S. bonds as a more stable investment option amidst fears of an equity downturn. Image: Bloomberg
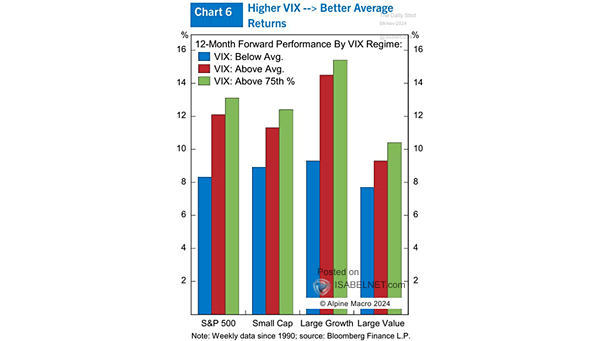
Volatility – Return vs. VIX While a higher VIX indicates increased market uncertainty, it can also present opportunities for investors to achieve better average returns by strategically navigating the volatility. Image: Alpine Macro
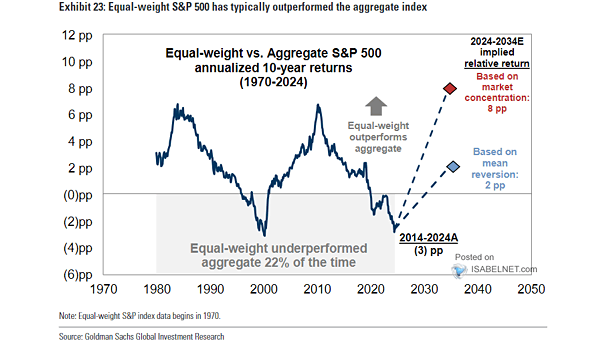
Equal-Weight vs. Aggregate S&P 500 Annualized 10-Year Returns Given the high concentration in today’s S&P 500, long-term investors may benefit from considering an equal-weight strategy in the current market environment. Image: Goldman Sachs Global Investment Research
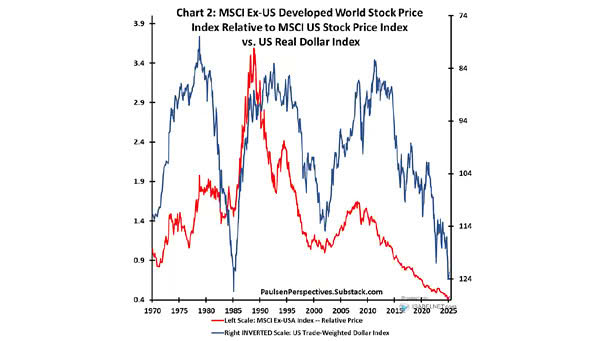
MSCI Ex-US Developed World Stock Price Index Relative to MSCI US Stock Price Index vs. US Real Dollar Index There is often an inverse relationship between the U.S. dollar and international stock markets, meaning that a peak in the dollar could make international stocks more appealing to investors. Image: Paulsen Perspectives

ISABELNET Cartoon of the Day The S&P 500 index is down 2.43% year-to-date, leaving bulls wondering if the bull market has a return policy. Meanwhile, bears seem to be having a bull-icious time! Happy Friday, Everyone! 😎
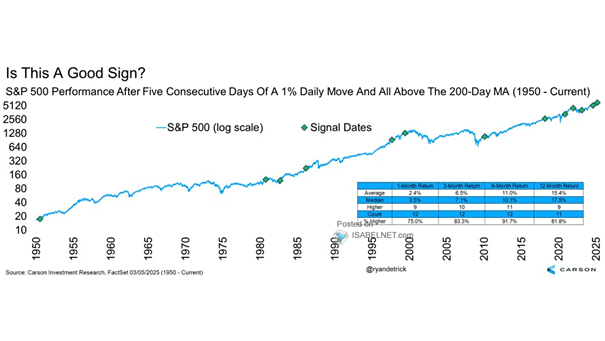
S&P 500 Performance After Five Consecutive Days of a 1% Daily Move and All Above the 200-Day MA Historically, when the S&P 500 has experienced five consecutive days of 1% moves while remaining above its 200-day MA, it has performed well over the following six months, averaging an 11.0% gain and rising 91.7% of the…
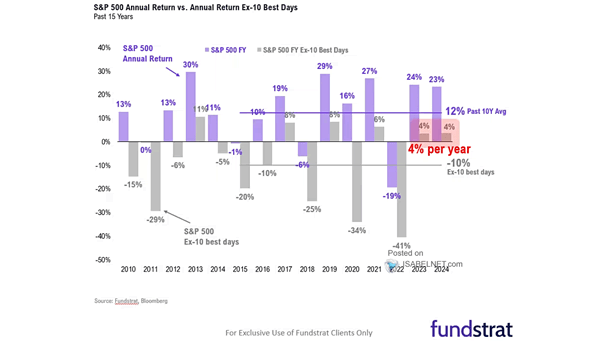
S&P 500 Annual Return vs. Annual Return Ex-10 Best Days The “rule of 10 best days” highlights the risks of market timing. Since 2015, excluding the 10 best trading days each year would have turned the S&P 500’s positive returns into significant losses. Image: Fundstrat Global Advisors, LLC