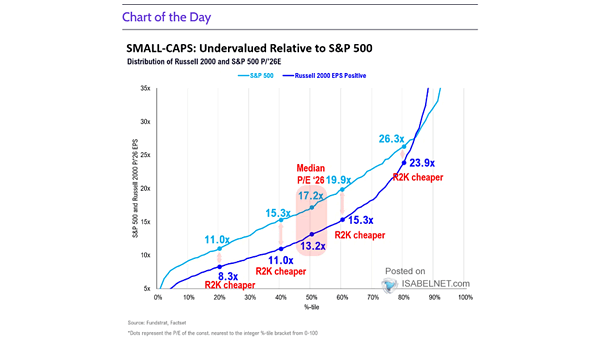
Equity Sector Returns

Equity Sector Returns While large-cap growth stocks, particularly those in the Magnificent 7, performed strongly in 2024, there was also a significant shift toward value sectors throughout the year, reflecting broader economic resilience. Image: J.P. Morgan Asset Management

S&P 500 Annual Returns

S&P 500 Annual Returns Bulls rejoice when the S&P 500 posts a 20% annual return. Historically, the following year has seen positive returns 81% of the time, with an average gain of 10.6% since 1950. Image: Carson Investment Research

Gold

Gold While the outlook for gold remains bullish due to falling interest rates and sustained central bank purchases, it is currently viewed as expensive when compared to oil prices and the average wage of a U.S. worker. Image: Gavekal, Macrobond

ISABELNET Cartoon of the Day

ISABELNET Cartoon of the Day The S&P 500 is currently expensive, but trying to time the market based on valuations is like using a sundial at midnight—good luck with that! Still, bears are eager to sell stocks! Have a Great Week, Everyone! 😎

China – Nominal GDP Growth vs. 10-Year Government Bond Yield

China – Nominal GDP Growth vs. 10-Year Government Bond Yield The persistent drop in bond yields is often seen as a sign of increasing investor caution regarding economic growth, which does not bode well for China’s nominal GDP growth moving forward. Image: Alpine Macro

S&P 500 Index Returns Based on Various Timeframes

S&P 500 Index Returns Based on Various Timeframes Investors who hold positions in the S&P 500 for longer periods are more likely to achieve profitable returns and can better navigate the inherent volatility of the stock market. Image: Carson Investment Research

Valuation – P/E Ratio of the Top 10 and Remaining Stocks in the S&P 500

Valuation – P/E Ratio of the Top 10 and Remaining Stocks in the S&P 500 Investor concerns regarding the high valuation of the S&P 500 and its top 10 stocks are growing, particularly as historical data suggests that elevated valuations can lead to subpar performance. Image: J.P. Morgan Asset Management

Equity Risk Premium

Equity Risk Premium The equity risk premium, at the 94th percentile from 2010 and at the 67th percentile from 2000, suggests that investors may not be receiving adequate compensation for the risks associated with investing in U.S. stocks. Image: J.P. Morgan Equity Macro Research

ISABELNET Cartoon of the Day

ISABELNET Cartoon of the Day Unfortunately for the bulls, it seems Santa Claus decided to skip the stock market this year—maybe he’s stuck in the hospital, which could lead to a bumpier ride for U.S. stocks ahead! Have a Great Weekend, Everyone! 😎

Real 10-Year Return – Spread: S&P 500 – Treasuries

Real 10-Year Return – Spread: S&P 500 – Treasuries Over the past decade, investors have reaped substantial rewards from equities, as stocks have significantly outperformed bonds. However, the outlook for the next ten years indicates that this trend may not persist. Image: Topdown Charts