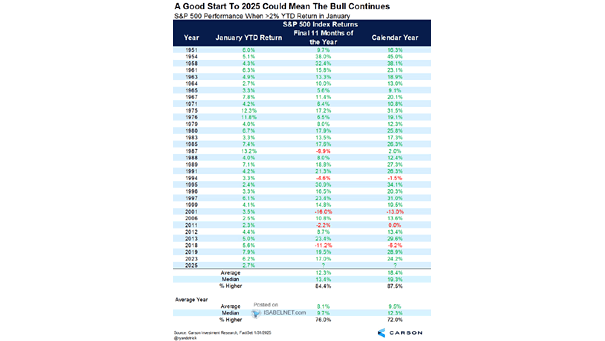
Asset Class Annualized Real Returns Since 1900

Asset Class Annualized Real Returns Since 1900 Since 1900, U.S. equities have delivered an annualized real return of 6.7%, highlighting their importance in long-term investment strategies and offering strong returns compared to other asset classes over the past century. Image: J.P. Morgan Asset Management

Euro to U.S. Dollar (EUR/USD)

Euro to U.S. Dollar (EUR/USD) The euro has dropped to a two-year low against the dollar due to concerns over a weak European economy, exacerbated by U.S. tariffs and anticipated interest rate cuts by the European Central Bank amid political instability. Image: Bloomberg

ISABELNET Cartoon of the Day

ISABELNET Cartoon of the Day New Year’s Resolution: Will you follow the bull or the bear? As we enter the new year, it’s crucial to establish a clear investment strategy, no matter if you’re feeling bullish or bearish. Happy Investing in 2025, Everyone! 😎

U.S. M2 to Nominal GDP Ratio

U.S. M2 to Nominal GDP Ratio The return of the U.S. M2 to nominal GDP ratio to its long-term trend is a positive indicator. It reflects a healthier balance between money supply and economic output, fostering stability and sustainable growth in the economy. Image: Federal Reserve Bank of St. Louis

Global Debt as % of GDP

Global Debt as % of GDP Over the past 25 years, the global debt-to-GDP ratio has risen significantly, driven by major economic events like the 2008 financial crisis and the COVID-19 pandemic. Image: Deutsche Bank

U.S. Small-Cap Stocks – Russell 2000

U.S. Small-Cap Stocks – Russell 2000 The small-cap Russell 2000 index has faced a notable downturn in December 2024, experiencing a decline of over 8%. This marks its worst monthly performance since September 2022, reflecting a notable shift in investor confidence. Image: Bloomberg

Annual Return of Treasuries – T-bills

Annual Return of Treasuries – T-bills In 2024, U.S. Treasuries have once again underperformed cash, resulting in a challenging year for bond investors. Many investors have found more appealing opportunities in cash savings or other asset classes. Image: Bloomberg

S&P 500 Gains of 20% Happen More Than Losses

S&P 500 Gains of 20% Happen More Than Losses Since 1950, the U.S. stock market has seen more years achieving gains of 20% or more than those with losses. This encourages investors to keep a long-term perspective and avoid panic selling—both crucial for building wealth. Image: Carson Investment Research

Seasonality – S&P 500 Monthly Returns

Seasonality – S&P 500 Monthly Returns The performance of the U.S. stock market in January is often considered as a key indicator for the year ahead. Although January’s stock returns can seem erratic, the median return has been around 1.5% since 1950. Image: Goldman Sachs Global Investment Research

Developed Market Core Inflation Rates

Developed Market Core Inflation Rates In most major economies, inflation rates have significantly eased. While challenges remain, current trends suggest that inflationary pressures are gradually coming under control. Image: Goldman Sachs Global Investment Research

S&P 500 Performance vs. Forward EPS

S&P 500 Performance vs. Forward EPS While long-term earnings are essential for driving stock prices over time, the influence of rising long-term yields cannot be overlooked. Image: Evercore ISI