
ISABELNET Cartoon of the Day
ISABELNET Cartoon of the Day The S&P 500 took a dive last week with a 1.94% loss. It seems bulls are feeling a bit under the weather—maybe too much partying at market highs! Have a Great Week, Everyone! 😎
ISABELNET Cartoon of the Day The S&P 500 took a dive last week with a 1.94% loss. It seems bulls are feeling a bit under the weather—maybe too much partying at market highs! Have a Great Week, Everyone! 😎
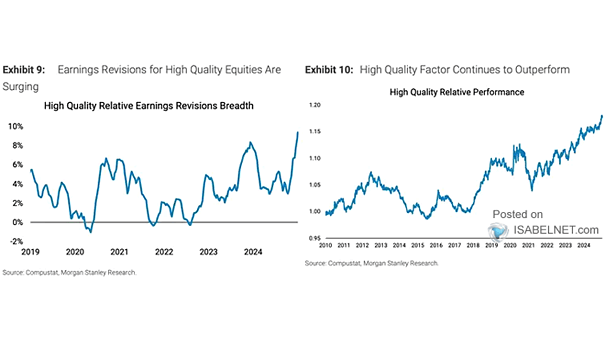
Stocks – High Quality Relative Earnings Revisions Breadth and High Quality Factor Relative Performance In a late-cycle market, investors looking for stability might find high-quality stocks appealing, given their historical ability to provide robust protection against both market volatility and economic downturns. Image: Morgan Stanley Research
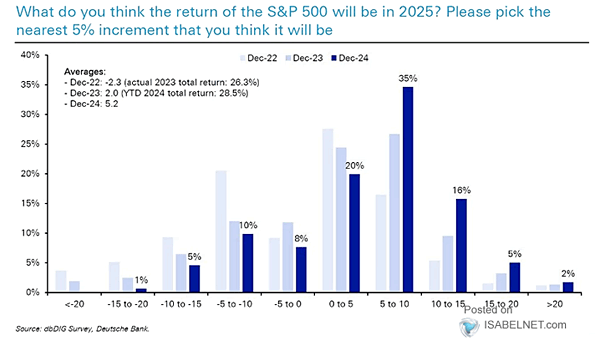
How Survey Responders Think the S&P 500 Will Perform Over the Year Ahead 35% of respondents expect the S&P 500 index to appreciate between 5% and 10% by the end of 2025, while 24% expect it to decline, and 23% predict an increase exceeding 10%. Image: Deutsche Bank
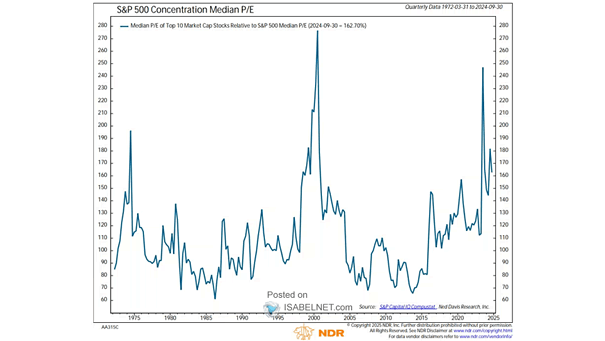
Valuation – S&P 500 Concentration Median P/E While the current median P/E of the top 10 stocks relative to the S&P 500 median P/E is historically high, it is still below the peaks seen during major market bubbles like the dot-com era and the Nifty Fifty period. Image: Ned Davis Research

ISABELNET Cartoon of the Day Bears hate that the S&P 500 has a history of strong performance following years of double-digit gains, when the first five trading days of the new year show positive results. Happy Friday, Everyone! 😎
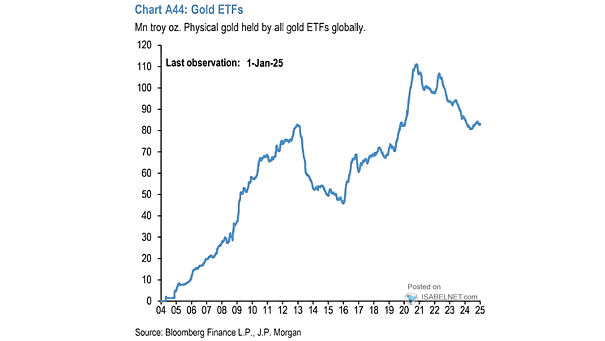
Physical Gold Held by all Gold ETFs Globally While central banks are increasing their gold reserves as a hedge against economic uncertainty and currency risks, global gold ETFs continue to see a decline in investor interest. Image: J.P. Morgan
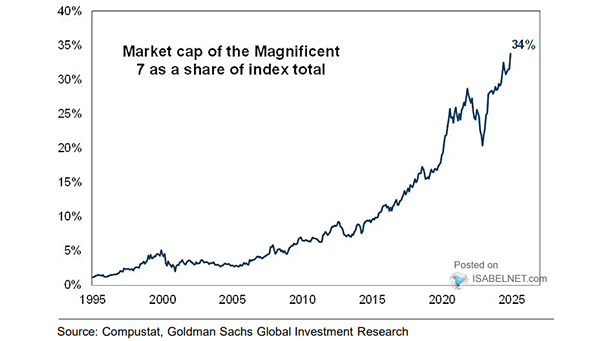
U.S. Stocks – Magnificent Seven Market Value as a Percent of S&P 500 Market Value The “Magnificent Seven” stocks have significantly influenced the S&P 500, now accounting for 34% of its market capitalization, reflecting their dominance and the concentrated risk in the market. Image: Goldman Sachs Global Investment Research
ISABELNET Cartoon of the Day Bears are struggling to find U.S. stocks that don’t make them feel like they’re overpaying—similar to buying a used car at full price from a salesman who claims it was only lightly driven by a little old lady! It’s already Wednesday, Happy “Hump” Day, Everyone! 🐫🐪😎
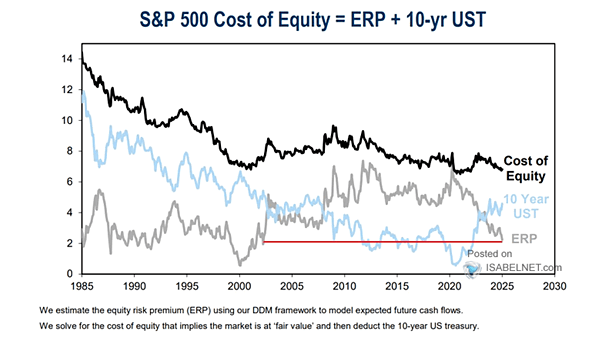
S&P 500 Equity Risk Premium With the S&P 500 equity risk premium hitting multi-decade lows, investors may find bonds more appealing than stocks. Image: Goldman Sachs Global Investment Research
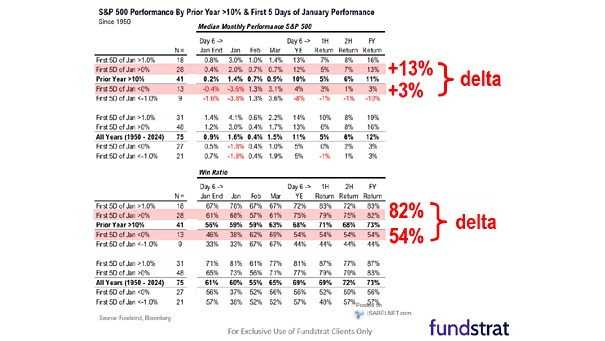
S&P 500 Performance by Prior Year >10% and First 5 Days of January Performance The S&P 500 has historically shown strong performance following years of double-digit gains, when the first five trading days of the new year are positive. Image: Fundstrat Global Advisors, LLC

ISABELNET Cartoon of the Day Even in a bull market, where the S&P 500 gained 0.55% yesterday, it seems bears have opted for a long vacation rather than hibernation! Have a Great Day, Everyone! 😎