Interest Rates – Expectations for the Fed’s Policy Rate Path
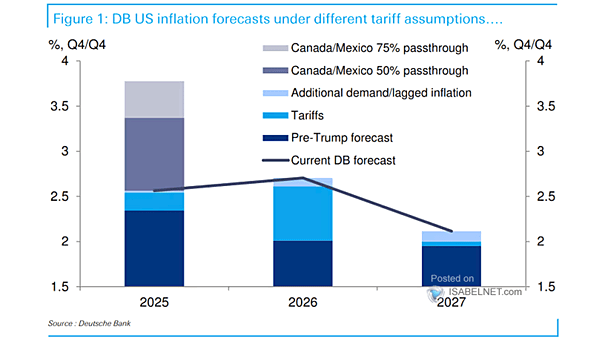
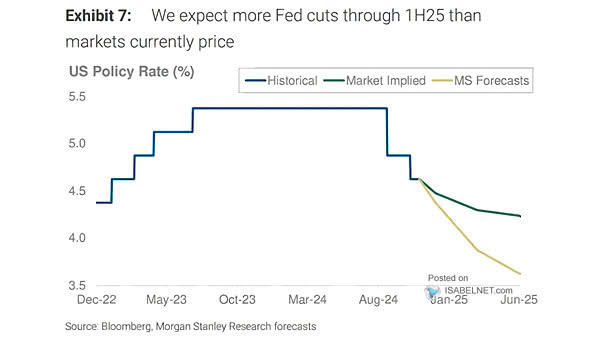
Interest Rates – Expectations for the Fed’s Policy Rate Path Morgan Stanley expects more Fed rate cuts in the first half of 2025 than markets currently price in, as the impact of tariffs will likely hit the U.S. economy, despite inflationary risks. Image: Morgan Stanley Research