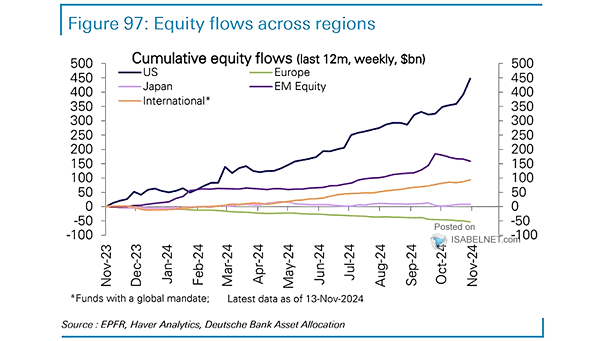
Cumulative Advance-Decline Line for the S&P 500 Index

Cumulative Advance-Decline Line for the S&P 500 Index The S&P 500 advance-decline line is a crucial indicator of market trends and sentiment. An all-time high typically indicates favorable news for the U.S. stock market. Image: Morgan Stanley Research

Copper to Gold Ratio and U.S. 10-Year Treasury Yield

Copper to Gold Ratio and U.S. 10-Year Treasury Yield The copper-to-gold ratio is often considered a leading indicator for the direction of the 10-year U.S. Treasury yield under certain market conditions. Image: The Daily Shot

10-Year Annualized S&P 500 Returns

10-Year Annualized S&P 500 Returns Goldman Sachs predicts that the S&P 500 will achieve an average annualized return of only 3% in the coming decade, considerably below historical norms, reflecting concerns about high equity valuations. Image: Goldman Sachs Global Investment Research

Global M2 Liquidity

Global M2 Liquidity The increase in global M2 money supply suggests that liquidity is on the rise, which is likely to stimulate economic activity and push equity markets higher. Image: Morgan Stanley Research

U.S. Corporate Income Tax Rate

U.S. Corporate Income Tax Rate The trend of declining effective tax rates among S&P 500 companies reflects broader economic shifts and policy decisions that have shaped the landscape of corporate taxation in the United States. Image: Goldman Sachs Global Investment Research

S&P 500 Performance After 6-Week Win Streaks

S&P 500 Performance After 6-Week Win Streaks Since 1950, 6-week win streaks have generally been bullish for U.S. stocks, averaging an 11.1% increase in value one year later, which gives investors strong reasons to expect a positive 2025. Image: Carson Investment Research

S&P 500 and Odds of Winning U.S. Presidential Election

S&P 500 and Odds of Winning U.S. Presidential Election The rising odds for Trump in prediction markets have been closely tied to an upswing in S&P 500 prices, reflecting investor sentiment that aligns with potential changes in economic policy should he win the election. Image: Morgan Stanley Research

S&P 500 Returns After Higher 10 of 11 Months

S&P 500 Returns After Higher 10 of 11 Months Since 1950, when the S&P 500 has been up 10 of the past 11 months using the first signal in a cluster, it has shown a strong tendency to be higher one year later, averaging a gain of 14.7%. Image: Carson Investment Research

Distribution of 10-Year S&P 500 Annualized Returns

Distribution of 10-Year S&P 500 Annualized Returns Goldman Sachs projects a modest average annualized total return of 3% for the S&P 500 over the next decade, considerably below historical averages, reflecting concerns about high equity valuations. Image: Goldman Sachs Global Investment Research

GWIM 4-Week ETF Flows as % of AUM

GWIM 4-Week ETF Flows as % of AUM BofA’s private clients have been buying municipals, dividend, utilities ETFs, and selling energy, EM debt, low-vol ETFs over the past four weeks. Image: BofA Global Investment Strategy

S&P 500 EPS – Potential U.S. Tax Impact on Earnings Per Share

S&P 500 EPS – Potential U.S. Tax Impact on Earnings Per Share Donald Trump’s plan to cut the U.S. corporate tax rate from 21% to 15% could significantly impact S&P 500 earnings per share, potentially increasing EPS by 4% and improving profitability for many companies in the index. Image: BofA US Equity & Quant Strategy