S&P 500 Returns After the Election
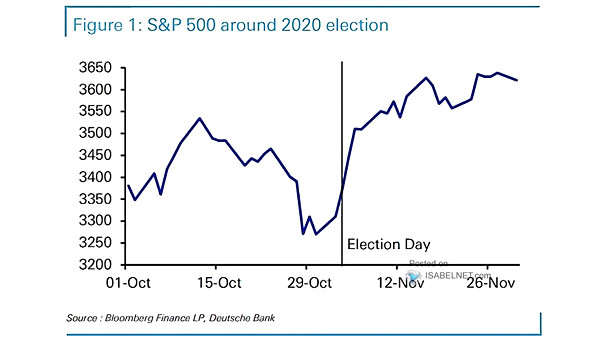
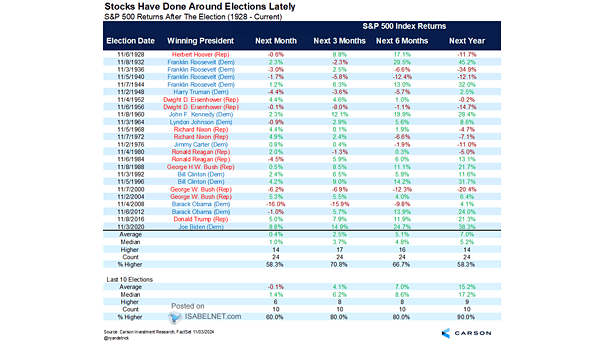
S&P 500 Returns After the Election The U.S. stock market has shown a notable tendency to perform well following presidential elections. In fact, after the last ten elections, stocks have increased in value nine times, with a median gain of 17.2% one year later. Image: Carson Investment Research