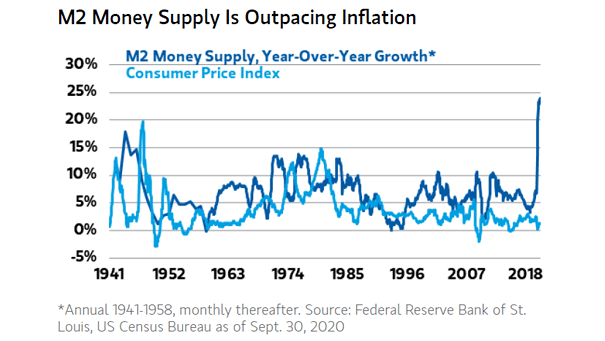
Cash to Total Assets S&P 500 and S&P 500 Ex-Financials

Cash to Total Assets S&P 500 and S&P 500 Ex-Financials The corporate cash cushion is thinning. S&P 500 firms have slashed their reserves from pandemic peaks, redirecting capital toward AI infrastructure, growth projects, and buybacks in a world where cash no longer comes cheap. Image: J.P. Morgan Equity Strategy and Global Quantitative Research

Risky vs. Safe Assets Fund Flows

Risky vs. Safe Assets Fund Flows Investors’ continued tilt toward riskier assets signals growing confidence in the markets and the broader economic outlook, alongside a clear appetite for capital growth and higher returns. Image: Goldman Sachs Global Investment Research

Share of S&P 500 Annual Return Contributed by the 10 Largest Stocks

Share of S&P 500 Annual Return Contributed by the 10 Largest Stocks In 2025, just 10 stocks generated more than half of the S&P 500’s gains, a reminder that the market’s engine is running on a few powerful cylinders. Image: Goldman Sachs Global Investment Research

S&P 500 Gains Between 8-10% Are Quite Rare

S&P 500 Gains Between 8-10% Are Quite Rare Going back to 1950, the S&P 500 has rarely delivered average returns in any given year. Will 2026 keep the winning streak alive with another year of double‑digit gains? Image: Carson Investment Research

ISM Manufacturing Index vs. S&P 500 Index

ISM Manufacturing Index vs. S&P 500 Index U.S. factory activity weakened further in December, as the ISM Manufacturing Index slipped to 47.9, short of expectations for 48.3, marking another month of contraction and lingering softness across the industrial sector. The chart shows the correlation between the U.S. ISM Manufacturing Index and the S&P 500 index…

Earnings Growth – Mag 7 and S&P 500 ex-Mag 7

Earnings Growth – Mag 7 and S&P 500 ex-Mag 7 This year, the Magnificent Seven are poised to post earnings growth of about 24%, twice the 12% projected for the rest of the S&P 500. Image: J.P. Morgan Asset Management

U.S. Stock Market Concentration

U.S. Stock Market Concentration The U.S. stock market is as concentrated as it has been in decades, but history is full of similar moments, from the railroad boom of 1900 to the dominance of mega-caps in the 1930s and 1960s. Image: Bloomberg

Performance – S&P 500 Relative to MSCI All-World Ex-U.S.

Performance – S&P 500 Relative to MSCI All-World Ex-U.S. The S&P 500 underperformed global markets by 9.9% in dollar terms in 2025, its biggest lag since 2009, as U.S. tariffs bit and the AI trade stayed locked in the hands of a few megacaps. Image: Bloomberg