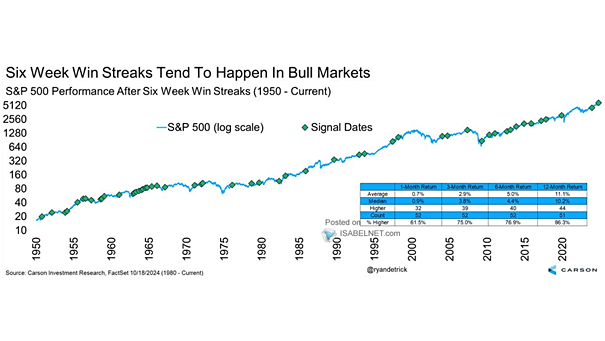
S&P 500 Performance After 6-Week Win Streaks
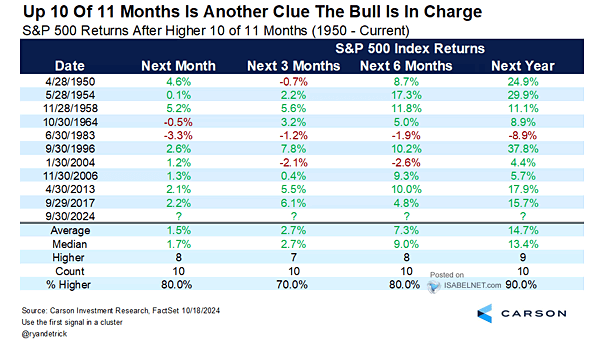
S&P 500 Performance After 6-Week Win Streaks Since 1950, 6-week win streaks have generally been bullish for U.S. stocks, averaging an 11.1% increase in value one year later, which gives investors strong reasons to expect a positive 2025. Image: Carson Investment Research