Real Estate Positioning
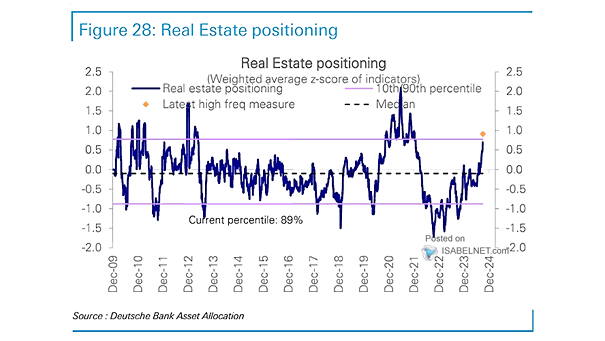
Real Estate Positioning Real estate positioning at the 89th percentile indicates strong interest from market participants. Image: Deutsche Bank Asset Allocation
Real Estate Positioning Real estate positioning at the 89th percentile indicates strong interest from market participants. Image: Deutsche Bank Asset Allocation
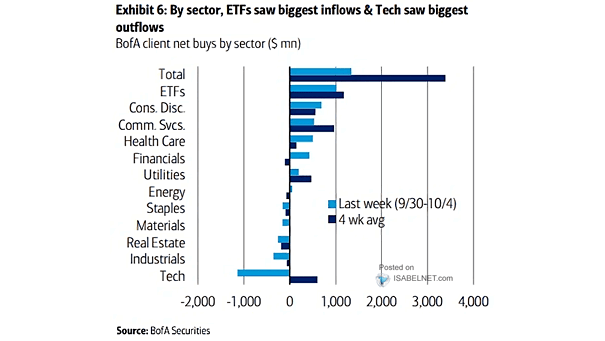
Market – Net Buys by Sector Last week, ETFs recorded the largest inflows, while the tech sector saw the largest outflows from BofA’s private clients. Image: BofA Securities
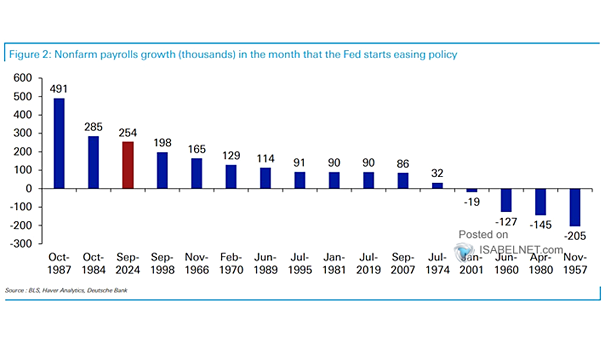
U.S. Labor Market – Nonfarm Payrolls Growth in the Month That the Fed Starts Easing Policy The recent rise in payroll numbers is surprising given the Fed’s easing of interest rates. Usually, strong job growth coincides with tighter monetary policy, but the current situation reveals a notable divergence. Image: Deutsche Bank
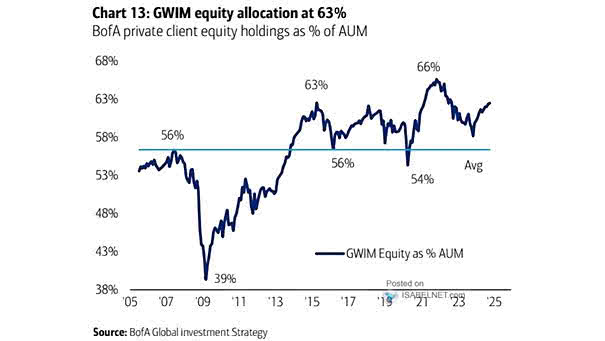
GWIM Equity Allocation as % Assets Under Management BofA’s private clients show optimism about equity market growth and potential returns, as evidenced by their 63% portfolio allocation to equities. Image: BofA Global Investment Strategy
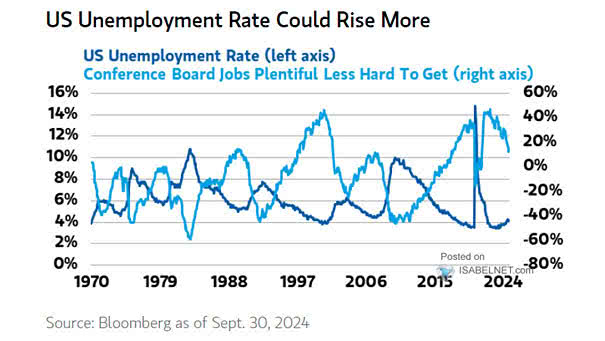
U.S. Labor Market – Unemployment Rate and Consumer Confidence Survey: Jobs “Plentiful” Minus Jobs “Hard to Get” Shifts in consumer perceptions regarding job availability suggest notable changes that could potentially lead to a rise in the U.S. unemployment rate. Image: Morgan Stanley Wealth Management
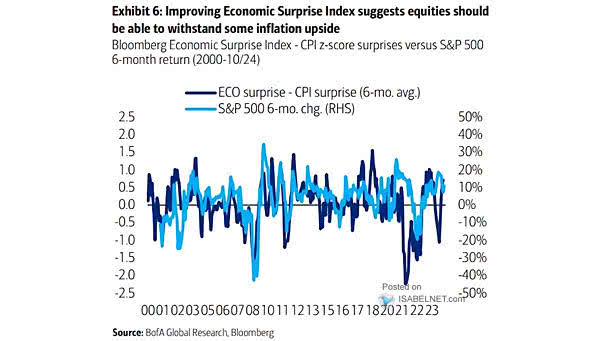
S&P 500 vs. U.S. Economic Surprise – CPI Surprise The improving economic surprise index and favorable macroeconomic conditions suggest that U.S. equities may better withstand inflation compared to previous cycles. Image: BofA Global Research
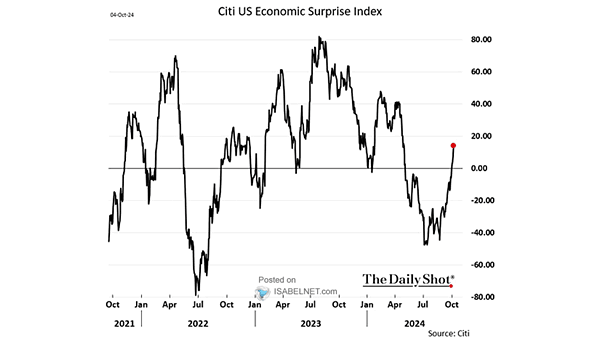
Citi U.S. Inflation Surprise Index Equities tend to perform well when the U.S. Economic Surprise Index increases, as this index indicates how much economic data surpasses expectations. Image: The Daily Shot
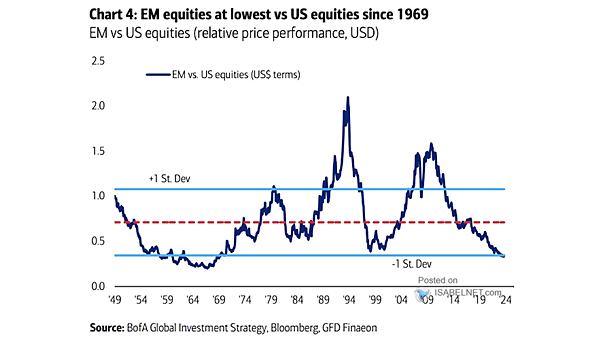
Performance – Price Ratio of Emerging Markets to U.S. Equities Since the global financial crisis, emerging market equities have continuously underperformed U.S. equities, leading to the current situation where the ratio between the two is at its lowest since 1969. Image: BofA Global Investment Strategy
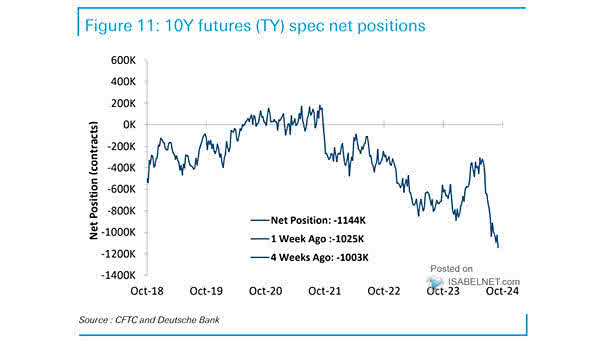
U.S. Treasury Bond Future – 10Y Futures Positions Speculators have significantly increased their short positions in U.S. Treasury 10Y futures, reflecting a strong bearish sentiment among traders. Image: Deutsche Bank Asset Allocation
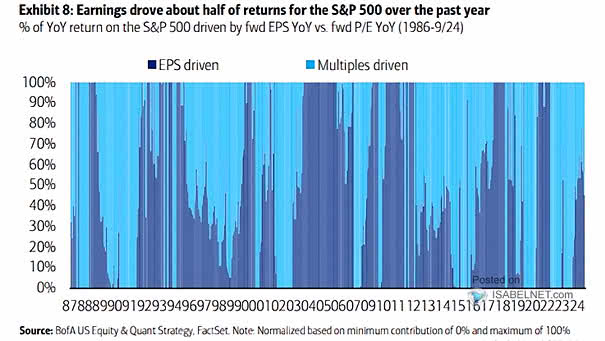
S&P 500 Earnings The impressive returns of the S&P 500 over the past year have been largely driven by earnings, particularly from a handful of high-performing tech stocks. Image: BofA US Equity & Quant Strategy
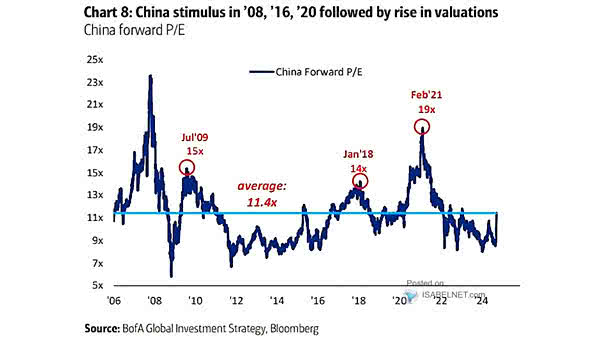
Equities – China’s Valuations If the MSCI China P/E ratio increases from its current range of 11-12x to a peak of 15-16x, this could represent a potential upside of approximately 40%. Image: BofA Global Investment Strategy