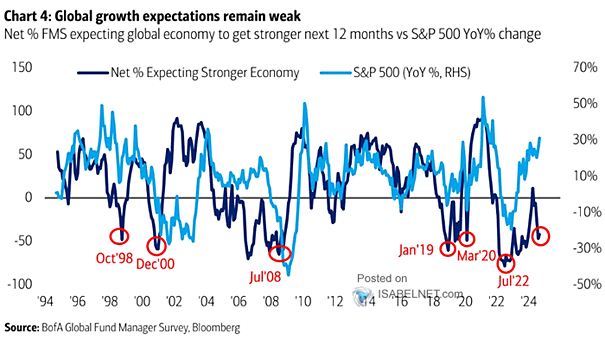
FMS Net % Expecting Stronger Economy vs. S&P 500
FMS Net % Expecting Stronger Economy vs. S&P 500 FMS investors remain pessimistic, anticipating a weak global economy over the next 12 months, resulting in a widening gap between their macroeconomic views and the performance of U.S. equities. Image: BofA Global Fund Manager Survey