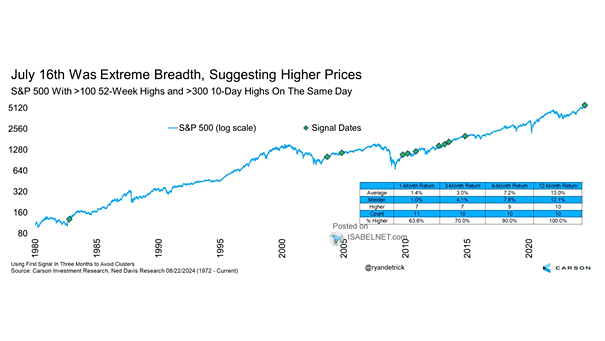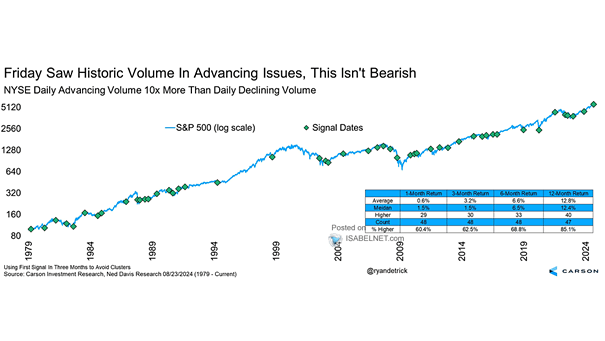
S&P 500 and NYSE Daily Advancing Volume 10x More than Daily Declining Volume
S&P 500 and NYSE Daily Advancing Volume 10x More than Daily Declining Volume When the daily advancing volume on the NYSE is ten times greater than the daily declining volume, it typically leads to higher S&P 500 prices over the next 12 months, with an average gain of 12.8% since 1979. Image: Carson Investment Research