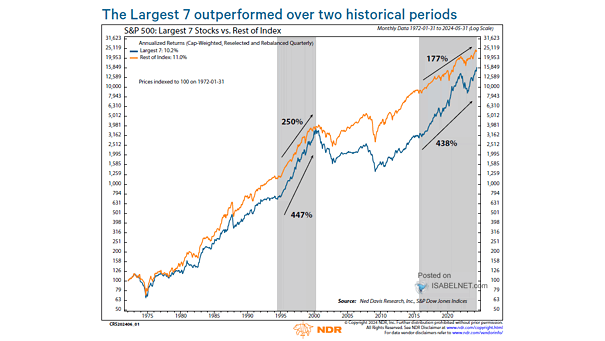
S&P 500 – Largest 7 Stocks vs. Rest of Index
S&P 500 – Largest 7 Stocks vs. Rest of Index Investing heavily in the largest seven U.S. stocks in a portfolio tends to underperform the rest of the S&P 500 index over the long term, potentially leading to a negative alpha. Image: Ned Davis Research