Hedge Funds – Net Buys
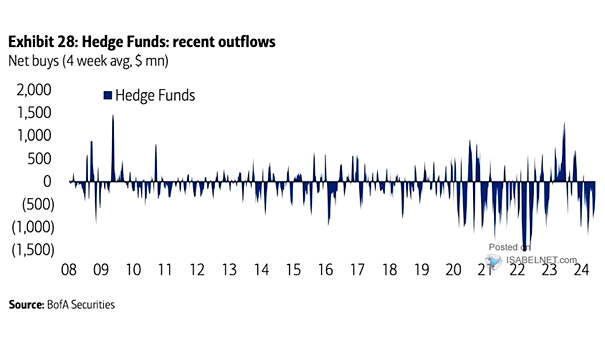
Hedge Funds – Net Buys Hedge funds continue to hit the sell button, resulting in significant outflows over the past 3 months. Image: BofA Securities
Hedge Funds – Net Buys Hedge funds continue to hit the sell button, resulting in significant outflows over the past 3 months. Image: BofA Securities
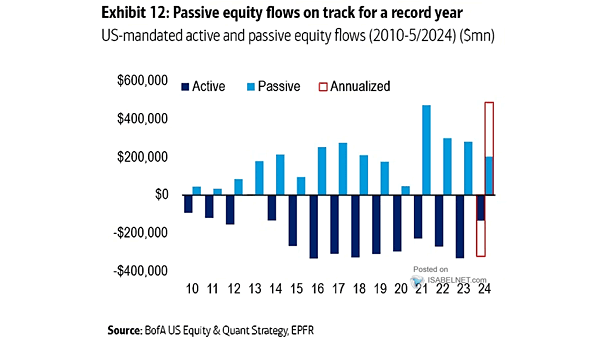
Flows by Year into Active vs. Passive Funds Passive funds are growing in popularity as investors prioritize lower fees, potential tax advantages, and doubt active fund managers’ ability to consistently outperform the market. As a result, active funds are facing capital outflows. Image: BofA US Equity & Quant Strategy
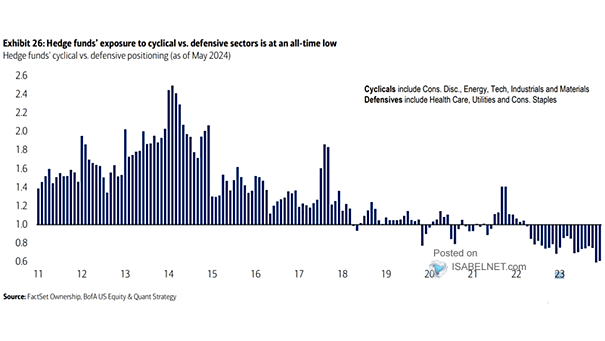
Hedge Funds’ Cyclical vs. Defensive Positioning During economic expansion, investors favor cyclicals over defensives. The current low hedge fund exposure to cyclical vs. defensive sectors may present a potential opportunity for contrarian investors. Image: BofA Global Research
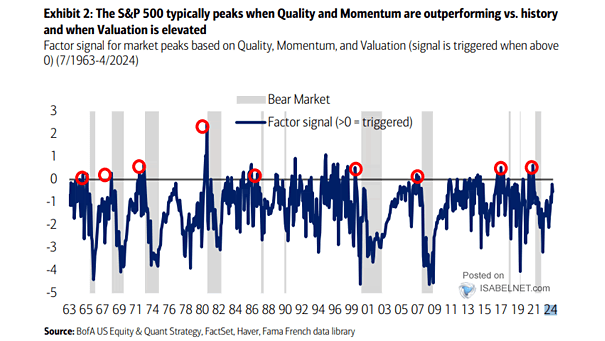
S&P 500 – Factor Signal for Market Peaks Based on Quality, Momentum, and Valuation The combination of quality and momentum factors outperforming vs. history, along with elevated valuations, could signal that the market is approaching a peak, prompting investors to adjust their portfolios accordingly. Image: BofA US Equity & Quant Strategy
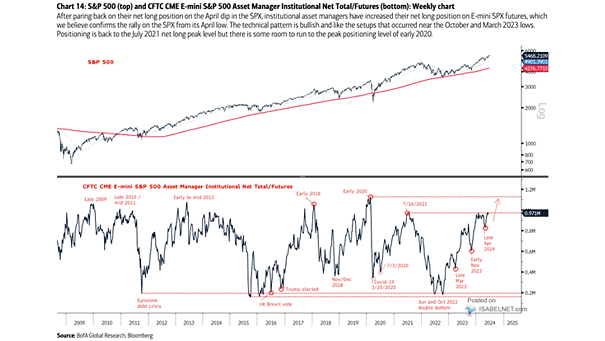
S&P 500 and CFTC CME E-mini S&P 500 Asset Manager Institutional Net Total/Futures The net long position held by institutional asset managers on E-mini S&P 500 futures has been rising, with the potential to reach the peak positioning level observed in early 2020. Image: BofA Global Research
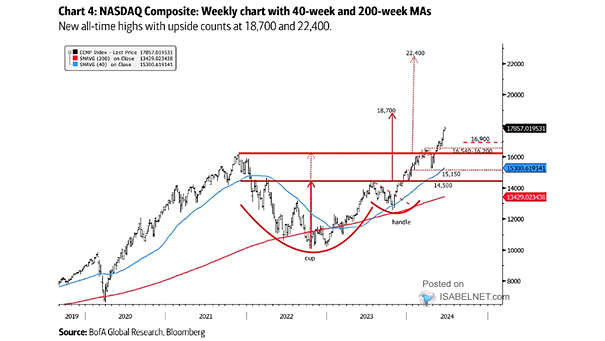
Nasdaq Composite Weekly Chart with 40-Week and 200-Week MAs The Nasdaq may potentially reach 18,700 and 22,400, given the possibility of a catch-up trade within a secular bull market presidential cycle. Image: BofA Global Research
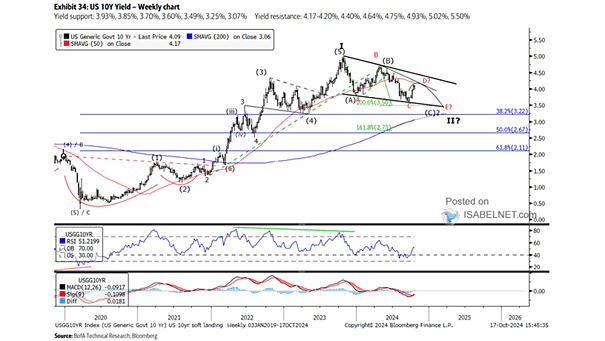
U.S. 10-Year Treasury Yield – Weekly Chart The outlook for the U.S. 10-year Treasury yield suggests a declining trend in the fourth quarter of 2024 and into the first quarter of 2025. Image: BofA Technical Research
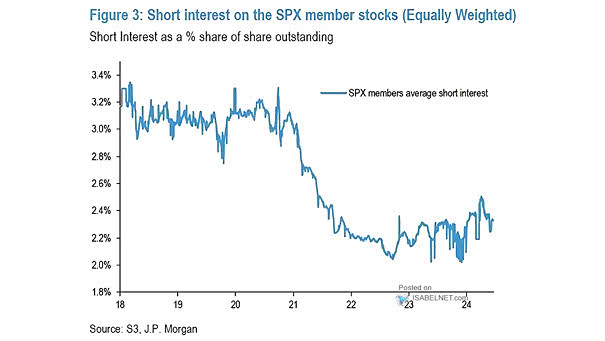
S&P 500 Short Interest The low average short interest level of the S&P 500 indicates that market participants are generally optimistic or not strongly bearish about the future performance of the S&P 500. Image: J.P. Morgan
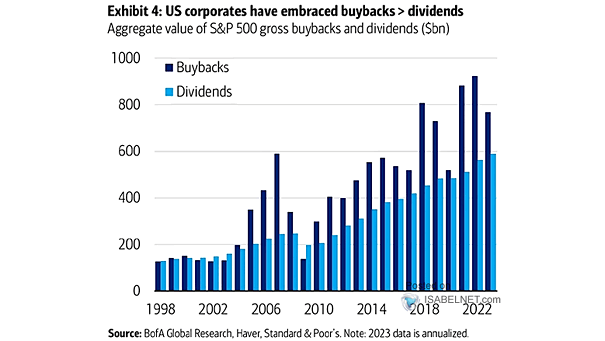
U.S. Share Buybacks and Dividends Over the past 20 years, U.S. corporates have clearly favored buybacks over dividends, reflecting a shift towards prioritizing shareholder value through capital appreciation rather than regular income distributions. Image: BofA Global Research
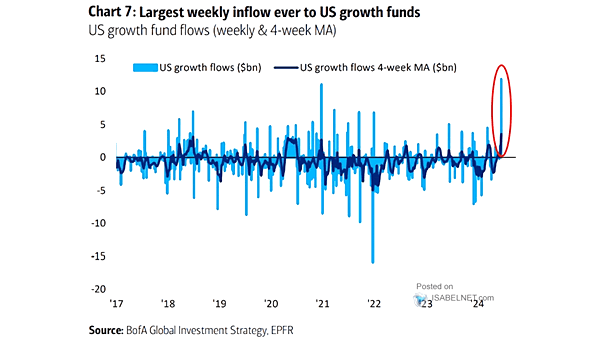
U.S. Growth Fund Flows Record inflows into U.S. growth funds reflect the increasing investor confidence in the potential for strong returns from companies positioned for expansion and innovation in the American market. Image: BofA Global Investment Strategy
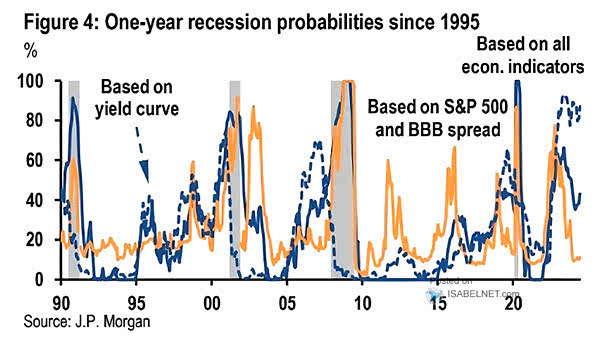
Probability of U.S. Recession within a Year Based on the tight spread between the S&P 500 and BBB-rated corporate bonds, the risk of a recession in the United States within one year appears low. Image: J.P. Morgan