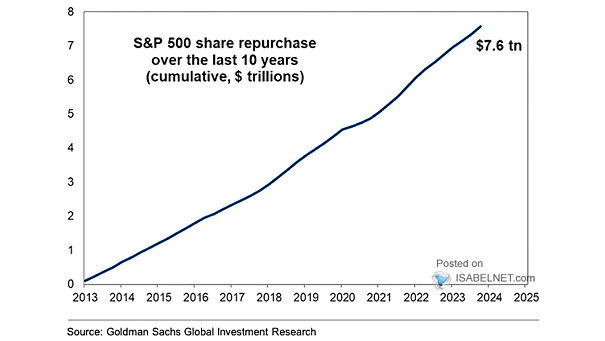
S&P 500 Share Buybacks
S&P 500 Share Buybacks $7.6 trillion of S&P 500 share buybacks over the last 10 years. While buybacks can benefit shareholders, critics argue that funds could have been better spent on research, development, and employee wages. Image: Goldman Sachs Global Investment Research