U.S. 10-Year Treasury Yield
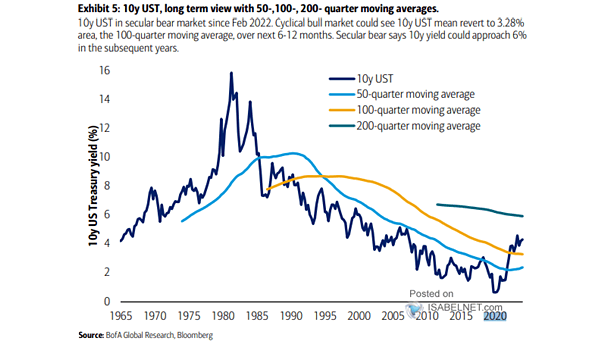
U.S. 10-Year Treasury Yield The 10-year U.S. Treasury yield has been in a secular bear market since February 2022, and it could potentially approach 6% in the coming years. Image: BofA Global Research
U.S. 10-Year Treasury Yield The 10-year U.S. Treasury yield has been in a secular bear market since February 2022, and it could potentially approach 6% in the coming years. Image: BofA Global Research
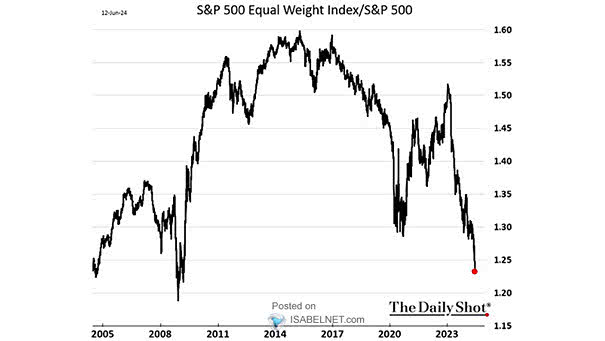
Performance – S&P 500 Equal Weighted / S&P 500 Market Cap Weighted The poor performance of the S&P 500 Equal Weight Index relative to the S&P 500 can be seen as an indication of the lack of broad participation in the market. Image: The Daily Shot
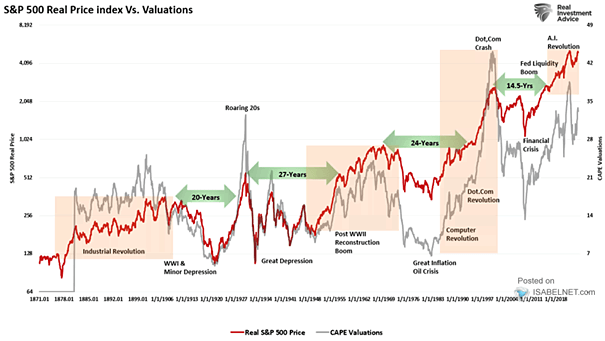
Real S&P 500 vs. Valuations (CAPE) The timing of your investment journey can significantly impact your future outcomes. Even with the Fed’s interventions, recovering from a bear market can take an extended period after speculative “booms.” Image: Real Investment Advice
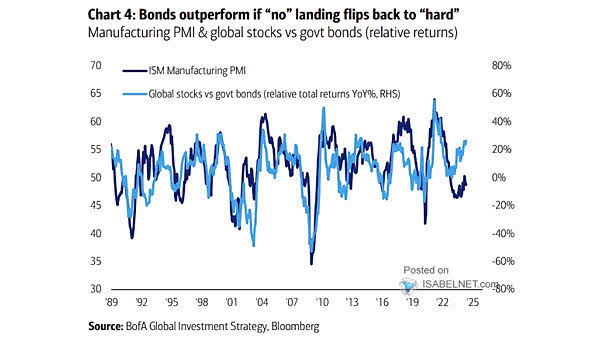
ISM Manufacturing PMI and Global Stocks vs. Government Bonds In a potential shift from a “no” to a “hard” landing scenario, government bonds may outperform due to increased risk aversion, interest rate cuts, lower inflation expectations, and their historical performance during economic downturns. Image: BofA Global Investment Strategy
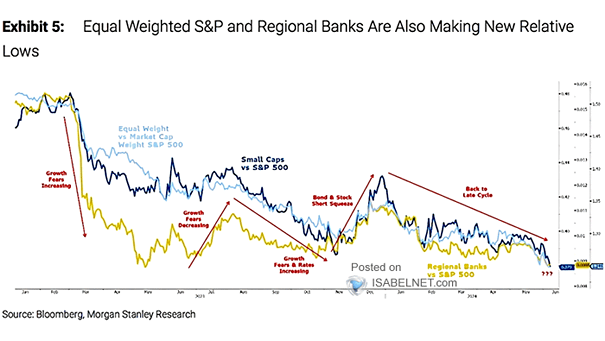
Performance – S&P Regional Banks Index vs. S&P 500 Regional banks and the equal-weighted S&P 500 have recently reached new relative lows, a concerning trend in the financial market. This trend is noteworthy given the recent S&P 500 performance. Image: Morgan Stanley Research
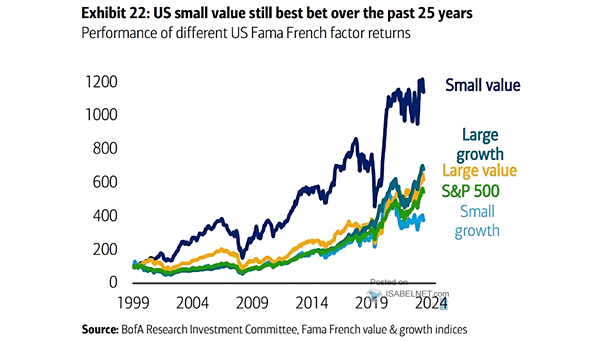
Performance of Different U.S. Fama French Factor Returns U.S. small-cap value has been the best bet over the past 25 years. However, small-cap value stocks are typically more volatile in the short term, making a long-term investment strategy necessary. Image: BofA Research Investment Committee
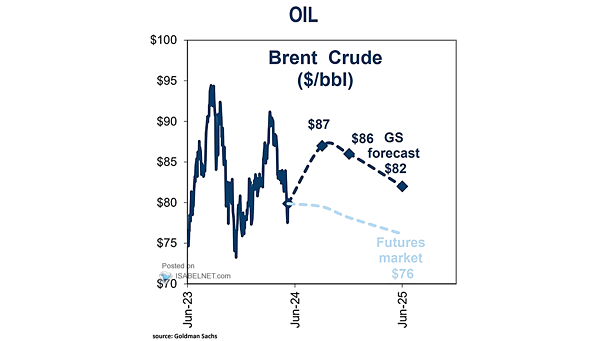
Price of Oil Forecast In contrast to futures market’s expectations, Goldman Sachs forecasts a positive outlook for oil prices over the next 3 months. Image: Goldman Sachs Global Investment Research
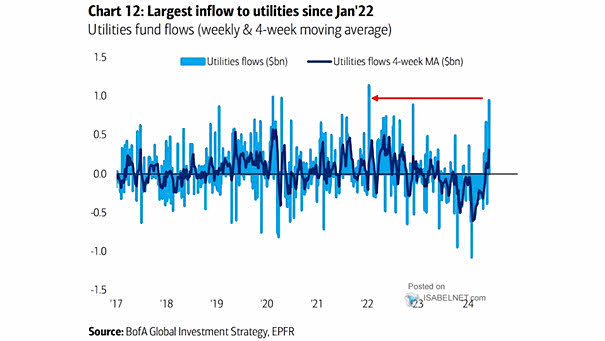
Utilities Flows Utility funds continue to attract strong inflows, making them a popular choice for investors seeking stable and predictable returns. Image: BofA Global Investment Strategy
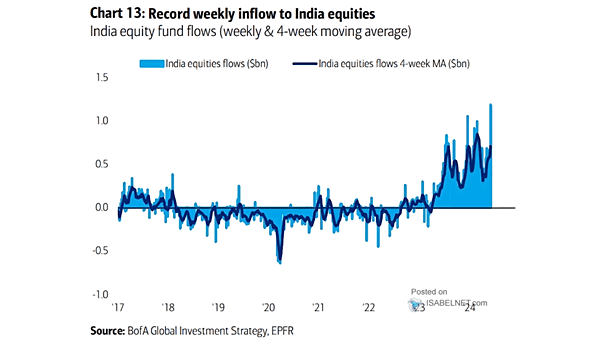
India Equity Fund Flows Investor behavior and sentiment are frequently gauged by analyzing fund flows. Over the past week, India equity funds experienced record inflows, indicating a surge in optimism among investors. Image: BofA Global Investment Strategy
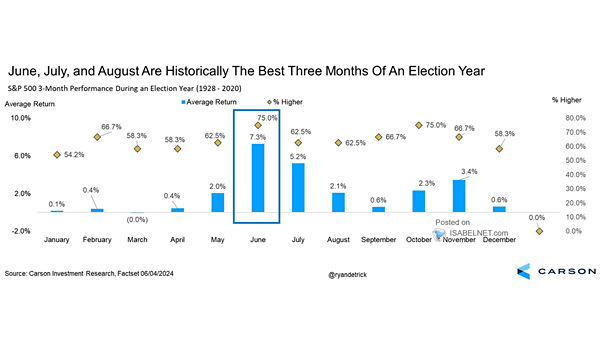
S&P 500 3-Month Performance During an Election Year In Presidential election years, June to August stands out as the strongest 3-month period of the year. The S&P 500 has been up 75% of the time, with an average return of 7.3% since 1928. Image: Carson Investment Research
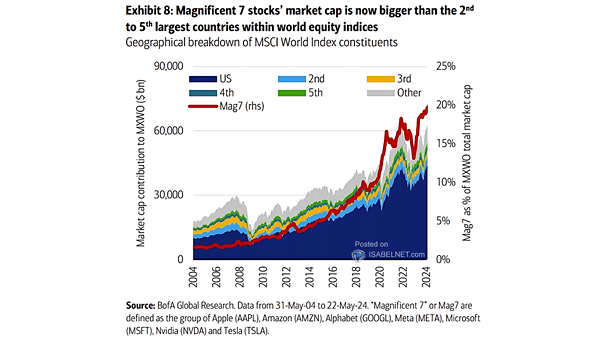
Market – Geographical Breakdown of MSCI World Index Constituents The combined market capitalization of the Magnificent Seven would make it the second-largest country stock exchange globally. This would surpass the total value of many thriving economies. Image: BofA Global Research