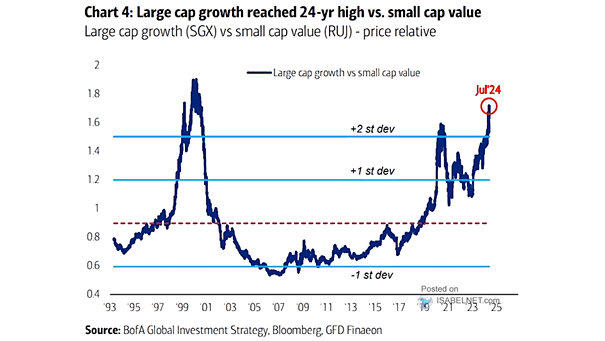
Performance – Large Cap Growth vs. Small Cap Value

Performance – Large Cap Growth vs. Small Cap Value Large-cap growth stocks are outperforming small-cap value stocks at a level not seen since the dot-com bubble era. Historical patterns and the potential for economic recovery indicate that this trend may change in the long term. Image: BofA Global Investment Strategy
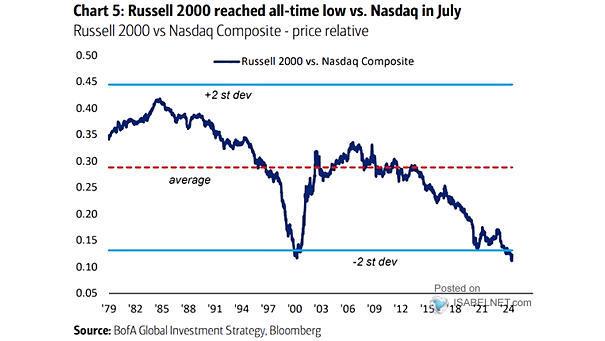
Performance – Ratio of Russell 2000 Index to Nasdaq Composite

Performance – Ratio of Russell 2000 Index to Nasdaq Composite Small-cap stocks are currently at a record low relative to the Nasdaq Composite. Factors that could drive small-cap stocks to outperform include a rise in M&A and IPOs, robust earnings growth, and changes in interest rates. Image: BofA Global Investment Strategy
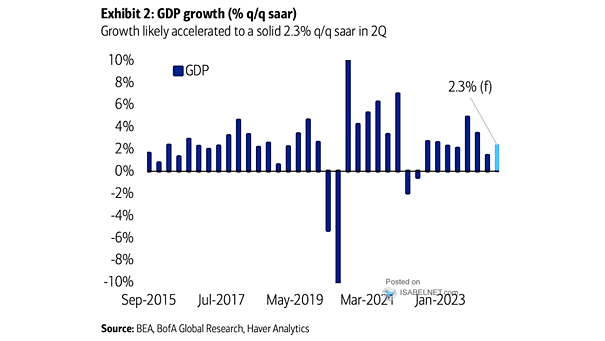
U.S. GDP Growth

U.S. GDP Growth BofA forecasts a robust U.S. GDP growth of 2.3% quarter-over-quarter (QoQ) seasonally adjusted annual rate (SAAR) in Q2 2024, reflecting the bank’s confidence in the resilience of the American economy. Image: BofA Global Research

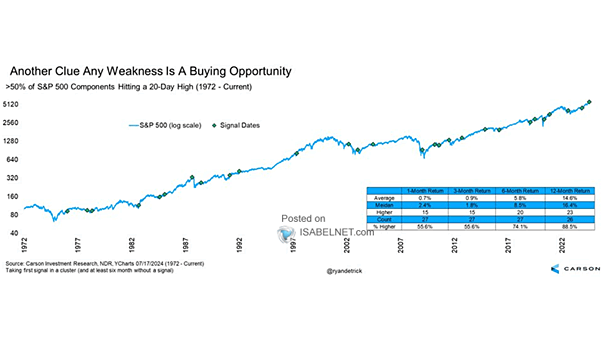
S&P 500 Performance After >50% of the Components Make a 20-Day High

S&P 500 Performance After >50% of the Components Make a 20-Day High When more than 50% of S&P 500 components hit a 20-day high, the S&P 500 index tends to perform strongly in the following 12 months, with a median increase of 16.4% in value seen a year later since 1972. Image: Carson Investment Research

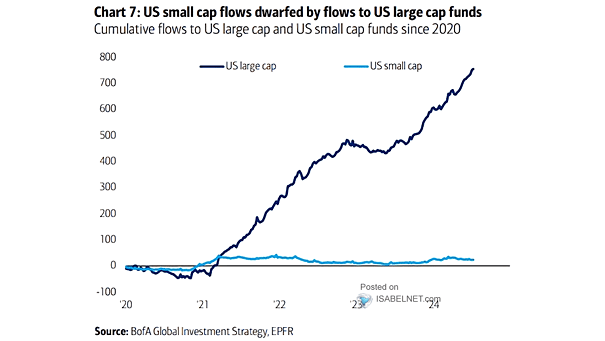
Cumulative Large Cap vs Small Cap Equity Flows

Cumulative Large Cap vs Small Cap Equity Flows Since 2021, U.S. large-cap funds have seen significantly higher inflows compared to U.S. small-cap funds, highlighting a broader trend of investor preference for larger, established companies. Image: BofA Global Investment Strategy
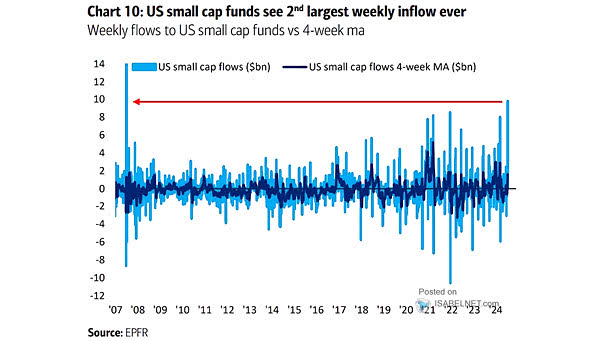
U.S. Small Cap Fund Flows

U.S. Small Cap Fund Flows The recent surge in inflows to U.S. small-cap funds highlights a favorable outlook on small-cap stocks as an investment option, as investors appear to be reallocating some of their assets toward this market segment. Image: BofA Global Investment Strategy
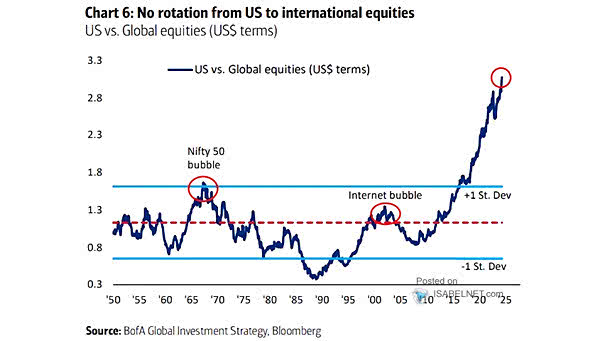
Performance – U.S. vs. Global ex-U.S.

Performance – U.S. vs. Global ex-U.S. Given that U.S. equities are at record highs compared to global stocks, should long-term investors consider reallocating a larger portion of their portfolios to global ex-U.S. stocks instead of heavily investing in U.S. equities? Image: BofA Global Investment Strategy
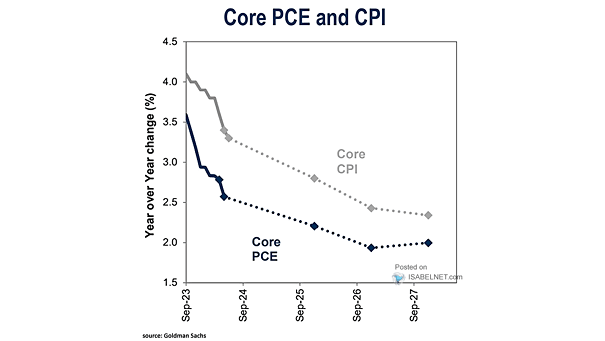
Inflation – U.S. Core PCE and Core CPI

Inflation – U.S. Core PCE and Core CPI Goldman Sachs’ forecast of a continuous decline in U.S. core PCE and core CPI suggests a potential slowdown in inflationary pressures, which could have significant implications for the overall economic outlook. Image: Goldman Sachs Global Investment Research

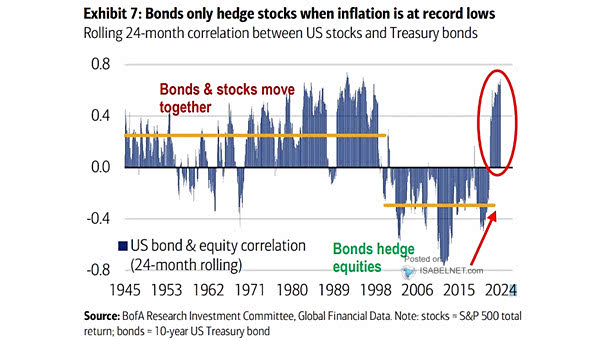
Rolling 24 Month Correlation Between U.S. Bonds and Equities

Rolling 24 Month Correlation Between U.S. Treasury Bonds and Equities Amid high inflation, UST bonds become less effective as a hedge against U.S. stocks, as rising prices erode bond payouts and interest rate hikes lead to a drop in bond prices. Image: BofA Research Investment Committee

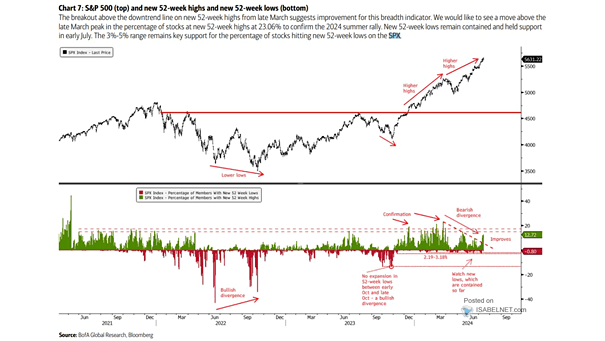
S&P 500 and New 52-Week Highs and New 52-Week Lows

S&P 500 and New 52-Week Highs and New 52-Week Lows The improvement in the percentage of S&P 500 stocks at new 52-week highs can be seen as a confirmation of a cyclical bull market. This indicates positive market sentiment and a potential upward trend for stocks. Image: BofA Global Research