U.S. Government Total Outlays

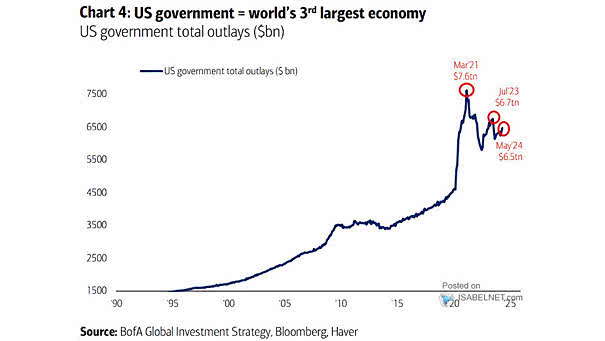
U.S. Government Total Outlays U.S. federal government spending has risen sharply since the 2020s, sparking debates about fiscal responsibility and the long-term implications for the U.S. economy. Image: BofA Global Investment Strategy
Top 10 Stocks as % of S&P 500

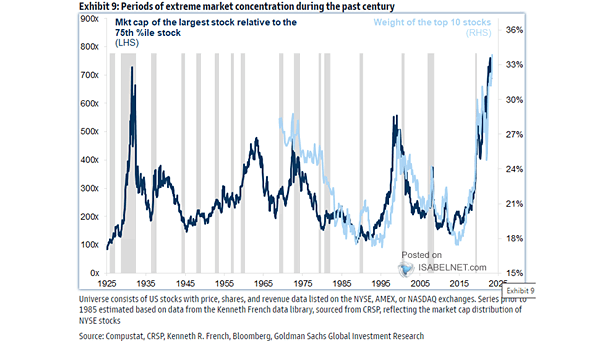
Top 10 Stocks as % of S&P 500 In recent years, there has been a substantial rise in concentration among the top 10 companies in the S&P 500, which has raised concerns about potential risks to investors. Image: Goldman Sachs Global Investment Research

Average S&P 500 Returns by the First and Second Half of the Month

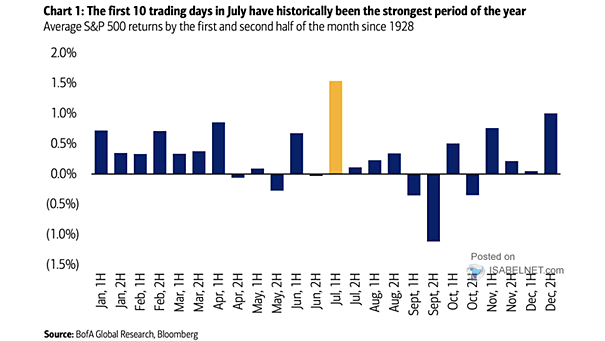
Average S&P 500 Returns by the First and Second Half of the Month Seasonality is a useful statistical tool, but not a crystal ball for predicting future market movements. Past patterns indicate that the U.S. stock market has often demonstrated strength in the first half of July. Image: BofA Global Research

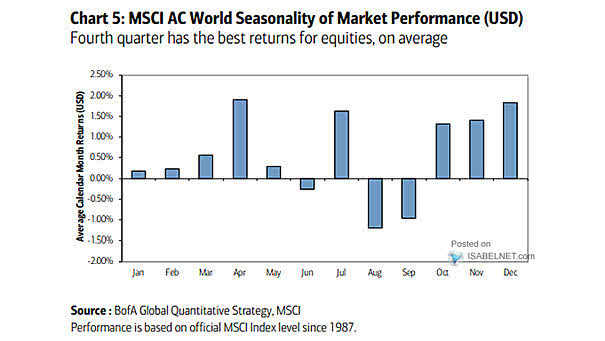
Seasonality Trends in MSCI AC World Index (Global Equities)

Seasonality Trends in MSCI AC World Index (Global Equities) July has historically been a strong month for global equities, offering opportunities for investors to capture potential gains. Image: BofA Global Quantitative Strategy

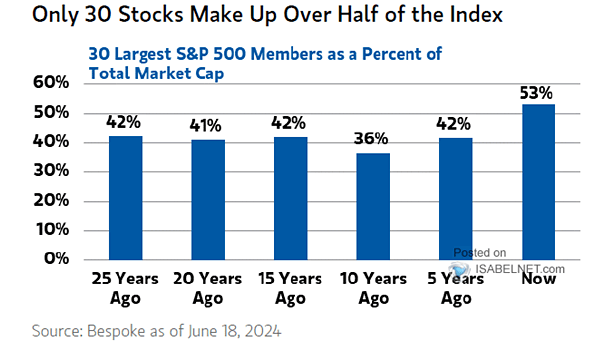
30 Largest Stocks as a Percentage of S&P 500 Market Capitalization

30 Largest Stocks as a Percentage of S&P 500 Market Capitalization The 30 largest stocks account for 53% of the S&P 500’s total market capitalization, raising concerns about the index’s concentration and potential risks. Image: Morgan Stanley Wealth Management

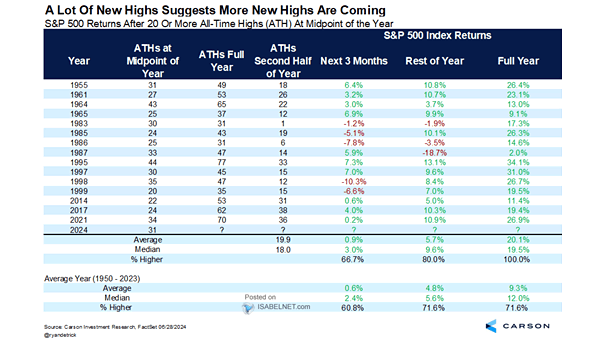
S&P 500 Returns After 20 or More All-Time Highs at Midpoint of the Year

S&P 500 Returns After 20 or More All-Time Highs at Midpoint of the Year Since 1950, when the S&P 500 index has made 20 or more all-time highs by mid-year, the full year has been positive 100% of the time, with an average of 20 new all-time highs in the second half. Image: Carson Investment…

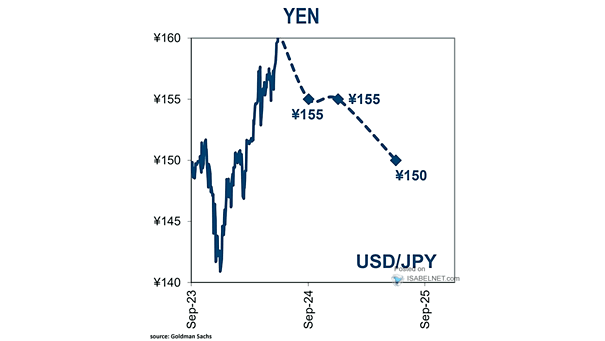
U.S. Dollar to Japanese Yen (USD/JPY)

U.S. Dollar to Japanese Yen (USD/JPY) Goldman Sachs has updated its projections for the USD/JPY exchange rate, anticipating the US dollar to reach 155 yen in three months, 155 yen in six months, and 150 yen in 12 months. Image: Goldman Sachs Global Investment Research

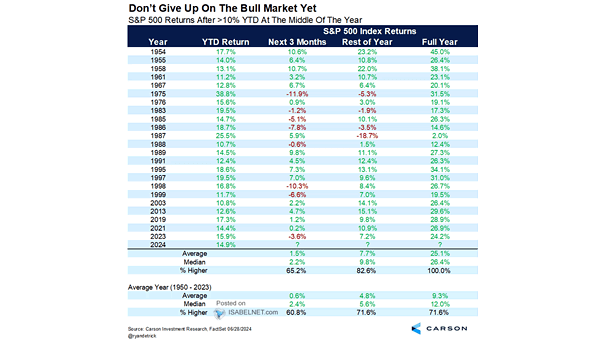
S&P 500 Returns After >10% YTD at the Middle of the Year

S&P 500 Returns After >10% YTD at the Middle of the Year Since 1950, when the S&P 500 index has been up more than 10% at the middle of the year, the full year has been positive 100% of the time with a median gain of 26.4%. Image: Carson Investment Research

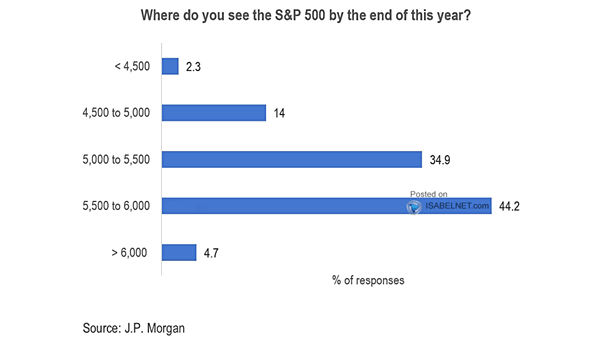
Where Do You See S&P 500 at Year End?

Where Do You See S&P 500 at Year End? Just 4.7% of JPM clients hold high expectations for the S&P 500 index, believing that it will surpass 6,000 by the end of 2024. This indicates a significant level of optimism regarding the future performance of the stock market. Image: J.P. Morgan