S&P 500 Buybacks vs. CEO Confidence (Leading Indicator)
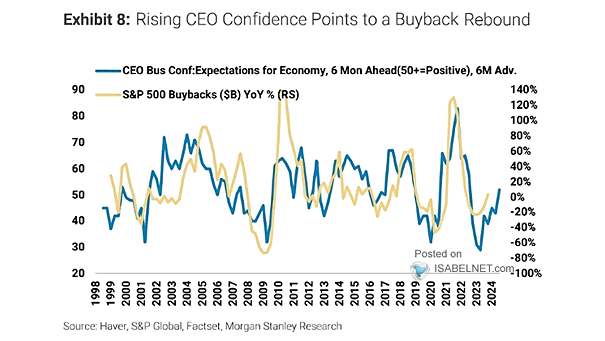
S&P 500 Buybacks vs. CEO Confidence (Leading Indicator) S&P 500 buybacks are likely to rebound, as CEO confidence typically leads buybacks by 6 months. Image: Morgan Stanley Research
S&P 500 Buybacks vs. CEO Confidence (Leading Indicator) S&P 500 buybacks are likely to rebound, as CEO confidence typically leads buybacks by 6 months. Image: Morgan Stanley Research
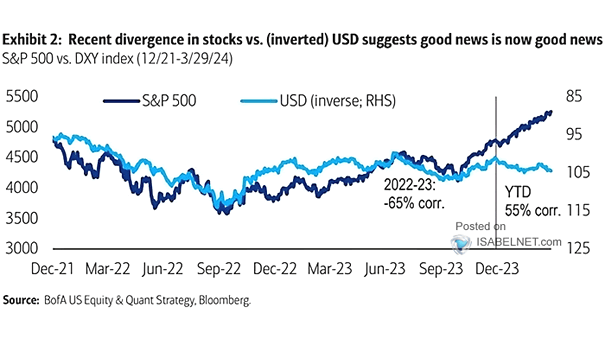
U.S. Dollar vs. S&P 500 The market is responding positively to good news, as indicated by the recent divergence between the S&P 500 and the U.S. dollar (inverted). This suggests a renewed sense of optimism in the market. Image: BofA US Equity & Quant Strategy
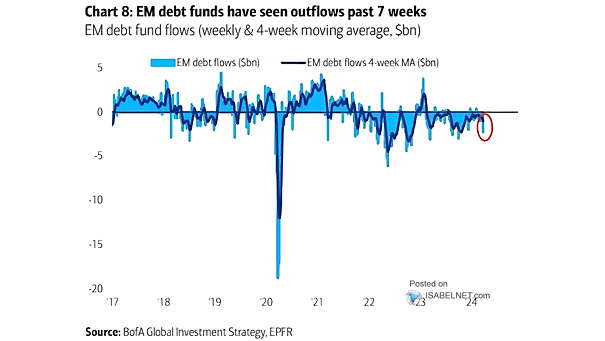
EM Debt Flows Outflows from emerging market debt persist, indicating a sustained trend of movement away from this financial asset. Image: BofA Global Investment Strategy
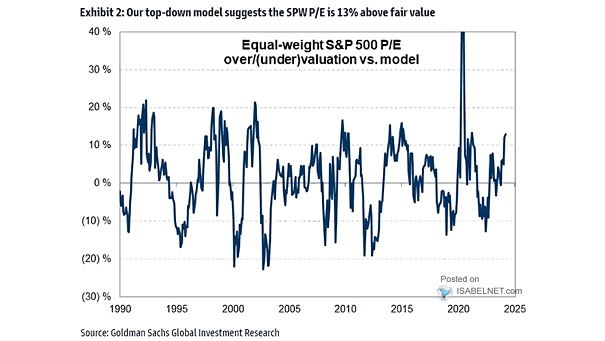
Valuation – Equal-Weight S&P 500 P/E Multiple According to Goldman Sachs, the equal-weight S&P 500 P/E multiple is currently 13% above fair value. This suggests that stocks in the S&P 500 Equal Weight Index may be relatively more expensive compared to their earnings potential. Image: Goldman Sachs Global Investment Research
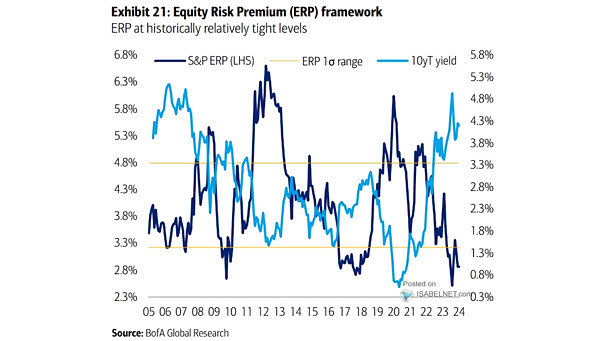
S&P 500 Equity Risk Premium Despite potential in U.S. equities, the decline in equity risk premium suggests caution is needed, prompting diversification across asset classes for risk management. Image: BofA Global Research

Stocks – Indexed Consensus NTM Net Income The widening gap in expected net income between mega-cap tech stocks and the bottom 493 stocks of the S&P 500 highlights the concentration risk and volatility associated with the dominance of these tech stocks in the index. Image: Goldman Sachs Global Investment Research
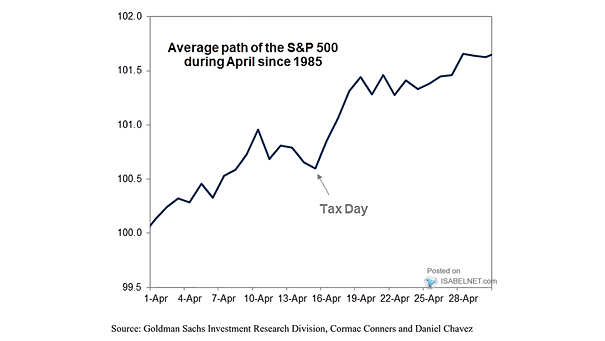
Average Path of the S&P 500 During April April has historically been a month of positive trends in the U.S. stock market, suggesting favorable sentiment and growth potential. Image: Goldman Sachs Global Investment Research
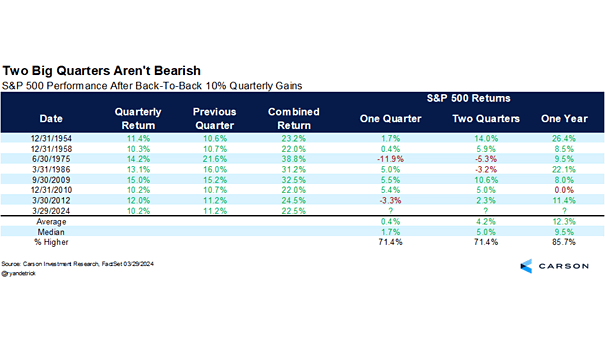
S&P 500 Performance After Back-To-Back 10% Quarterly Gains Following two consecutive quarterly gains of 10%, which is quite rare, the S&P 500 has, on average, increased by 12.3% a year later since 1954. Image: Carson Investment Research
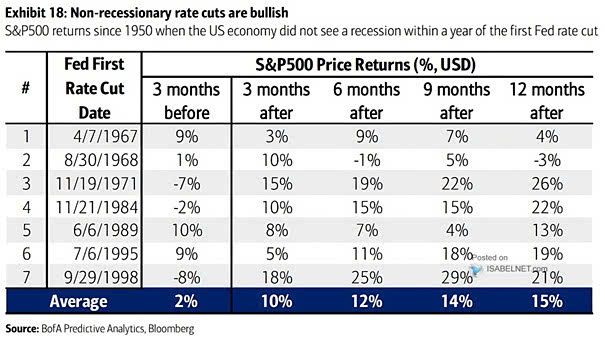
S&P 500 After Initial Fed Rate Cuts Outside Of Recession Outside of recessions, U.S. stocks have tended to rise after the Fed’s first rate cut, with an average gain of 15% within 12 months. Image: BofA Predictive Analytics
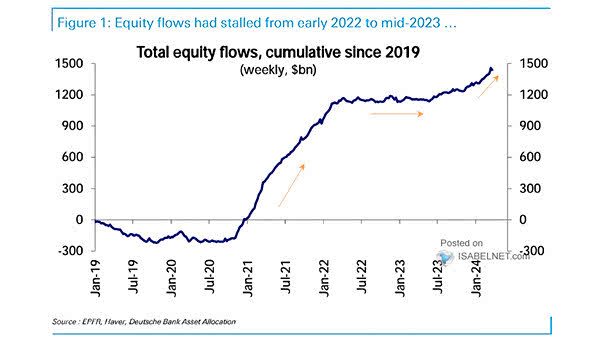
Total Equity Flows Since mid-2023, there has been a notable resurgence in equity flows. This upward trend brings promising implications and serves as a positive development for investors. Image: Deutsche Bank Asset Allocation
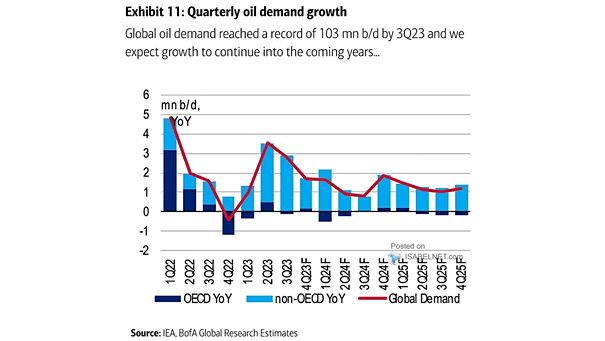
Global Oil Demand Growth BofA forecasts that global oil demand will continue to grow, but at a slower pace in the coming years, due to the increasing efficiency of energy technology. Image: BofA Global Research Estimates