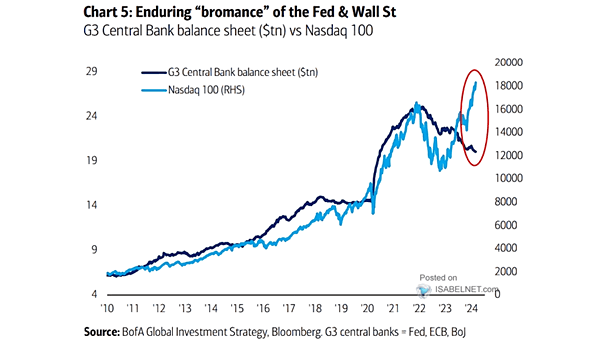
S&P 500 Real Price Index

S&P 500 Real Price Index Since 1871, approximately 40% of the years have seen a negative real price return for the inflation-adjusted S&P500 index. Image: Goldman Sachs Global Investment Research

Valuation – S&P 500 Trailing PE

Valuation – S&P 500 Trailing PE After the fall of the Berlin Wall, globalization had a significant impact on various aspects of the global economy, including financial markets, as evidenced by the P/E ratios of the S&P 500 index. Image: Morgan Stanley Wealth Management

Weekly Equity Fund Flows

Weekly Equity Fund Flows Equity funds seeing $82 billion inflows over the past 10 weeks indicates the strong confidence investors have in the potential returns in equity markets. Image: BofA Global Investment Strategy

S&P 500 Performance After 9-Week Win Streaks

S&P 500 Performance After 9-Week Win Streaks Historically, 9-week win streaks tend to be bullish for U.S. stocks, with a median 12.4% increase in value seen a year later since 1950, giving investors good reason to expect a positive year in 2024. Image: Carson Investment Research

Investor Psychology Cycle

Investor Psychology Cycle When investor psychology is overly negative, it may indicate undervalued market prices, presenting buying opportunities for investors who are able to take a contrarian approach and invest when others are fearful. Image: Real Investment Advice

U.S. 10-Year Treasury Yield vs. 10-Year Bund Yield

U.S. 10-Year Treasury Yield vs. 10-Year Bund Yield It is becoming more common for German bund yields to be below U.S. yields, which can be attributed to the difference in economic conditions and fiscal policies between Germany and the United States. Image: Gavekal, Macrobond

U.S. Unemployment Rate Forecast

U.S. Unemployment Rate Forecast According to Deutsche Bank, a mild recession in the United States may result in a modestly higher unemployment rate than what is anticipated by both consensus and the Federal Reserve. Image: Deutsche Bank

S&P 500 – Average / Median Return by Month

S&P 500 – Average / Median Return by Month January typically emerges as one of the most favorable months for S&P 500 returns. However, February and March often experience a notable decline in returns, presenting a comparatively weaker period for investors. Image: Real Investment Advice

20% Yearly Gains for the S&P 500 Index and What Happened Next

20% Yearly Gains for the S&P 500 Index and What Happened Next A significant annual gain of 20% in the S&P 500 index is often indicative of continued positive performance in the following year, with a median return of 12.1% seen a year later since 1950. Image: Carson Investment Research