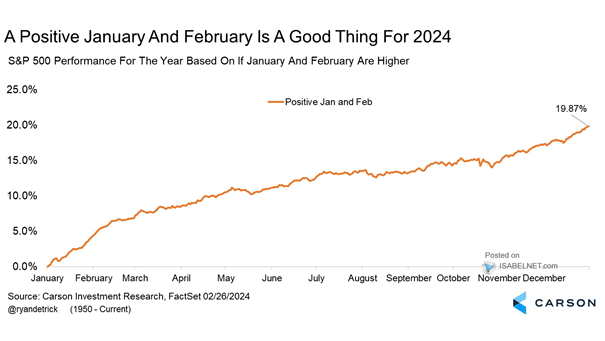
China Real GDP Growth Forecast
China Real GDP Growth Forecast The downturn in growth in China may be stabilizing. Image: Goldman Sachs Global Investment Research
S&P 500 Valuations vs. 6-Month Forward Returns Valuations can help frame long-term return expectations, but they rarely say much about what markets will do in the short run. Image: Goldman Sachs Global Investment Research
Performance – Ratio of Russell 2000 Index to Russell 1000 Index The underperformance of small caps relative to large caps raises questions about their capacity to adapt to rapid changes in the economic landscape. Image: Morgan Stanley Wealth Management
Consensus U.S. GDP Growth Could the United States experience a significant deceleration in GDP growth in the near future? Image: Deutsche Bank Asset Allocation
Valuation – S&P 500 NTM P/E Ratio The NTM P/E ratio of the S&P 500, excluding the 7 largest stocks, is at a relatively reasonable level of 17x. Image: Goldman Sachs Global Investment Research
Sentiment – Global PMI and Risk Appetite Indicator The GS risk appetite indicator remaining elevated suggests that investors have a high appetite for risk in the financial markets. Image: Goldman Sachs Global Investment Research
Hard/Soft/No Landing Pricing Across Asset Classes Investors may allocate cash to bonds in hard landing, a combination of stocks and credit in soft landing, commodities in no landing. Image: BofA Global Investment Strategy
Macro Forecasts Goldman Sachs predicts that the S&P 500 will reach 4,700 and the 10-year U.S. Treasury yield will be at 3.8% in 12 months. Image: Goldman Sachs Global Investment Research
U.S. Real GDP “New-New Normal” Will a sustained period of low economic growth be the “new normal” for the United States? Image: Real Investment Advice
Japanese Banks Stock Price Index vs. Japanese Stocks Given the increase in Japanese government bond yields, should investors favor Japanese bank stocks? Image: BofA Global Investment Strategy
Consecutive Trading Days of Inverted 10Y-3M U.S. Treasury Yield Curve The inversion of the 10Y-3M UST yield curve typically reflects market expectations of slower economic growth and potentially lower interest rates in the future. Image: Morgan Stanley Wealth Management