S&P 500 – Change in Liquidity
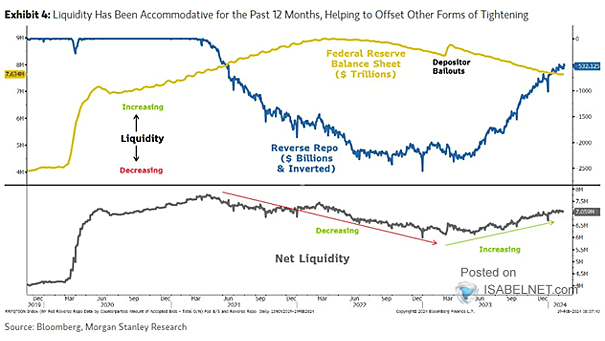
S&P 500 – Change in Liquidity Will the support given to U.S. equities through the increase in net liquidity since March 2023 persist until the end of the year? Image: Morgan Stanley Research
S&P 500 – Change in Liquidity Will the support given to U.S. equities through the increase in net liquidity since March 2023 persist until the end of the year? Image: Morgan Stanley Research
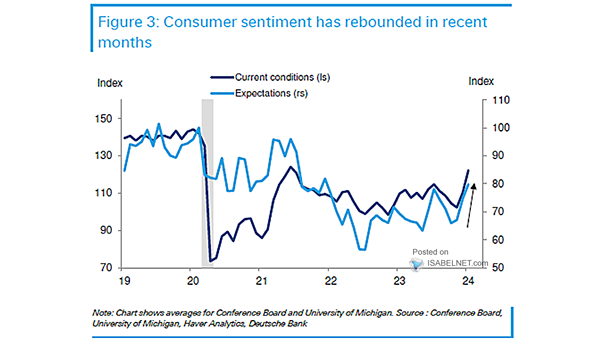
U.S. Consumer Sentiment and Recession In recent months, U.S. consumer sentiment has improved markedly, mainly due to lower inflation, the positive performance of risk assets and a recovery in real income growth. Image: Deutsche Bank
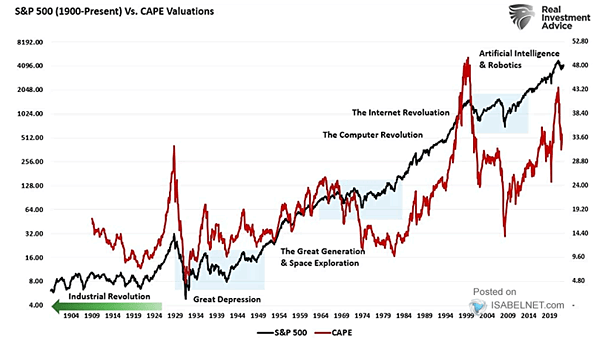
S&P 500 – CAPE Valuations While a high CAPE ratio can persist for extended periods without triggering a market correction, historical data suggests that such periods of elevated valuations are typically followed by lower stock market returns. Image: Real Investment Advice
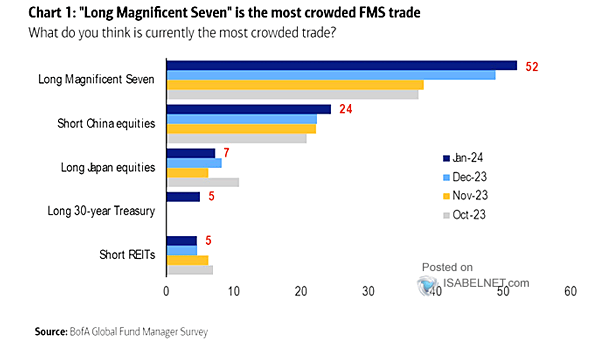
What Do You Think Is Currently the Most Crowded Trade? The “Long Magnificent Seven” trade remains widely considered the most crowded trade among FMS investors. The popularity of these stocks may be attributed to their robust performance and dominant position in the market. Image: BofA Global Fund Manager Survey
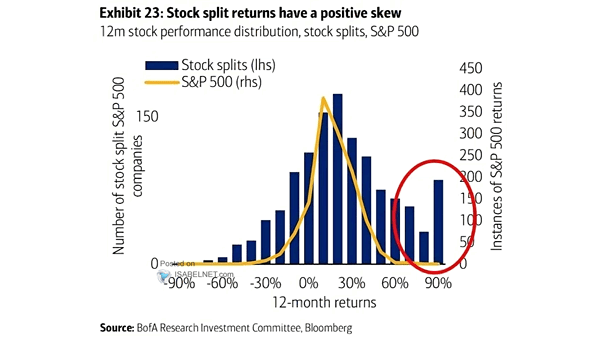
Stock Splits and S&P 500 – 12-Month Stock Performance Distribution A stock split can often generate renewed investor interest and potentially lead to a positive impact on the stock price. Image: BofA Research Investment Committee
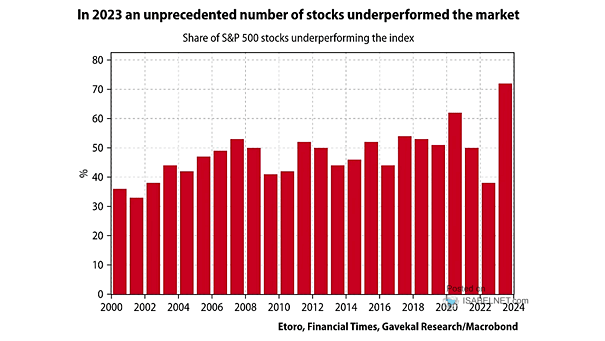
Share of S&P 500 Stocks Underperforming the Index Despite the strong performance of the S&P 500 index in 2023, more than 70% of the individual stocks within the index underperformed, indicating that the overall gains were driven by a relatively small number of stocks. Image: Gavekal, Macrobond
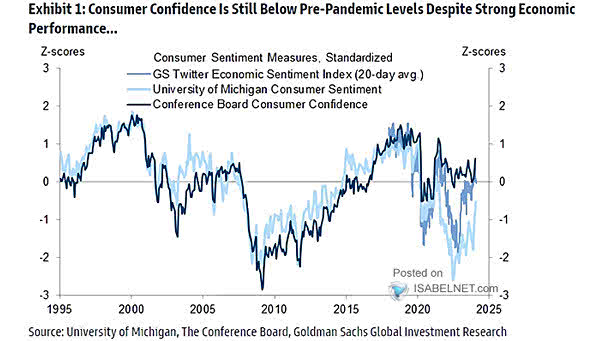
Conference Board Consumer Confidence, Twitter Sentiment Index, University of Michigan Consumer Sentiment Despite strong economic performance, U.S. consumer confidence has shown improvements but has not yet returned to pre-pandemic levels, indicating that the recovery process is not yet complete. Image: Goldman Sachs Global Investment Research
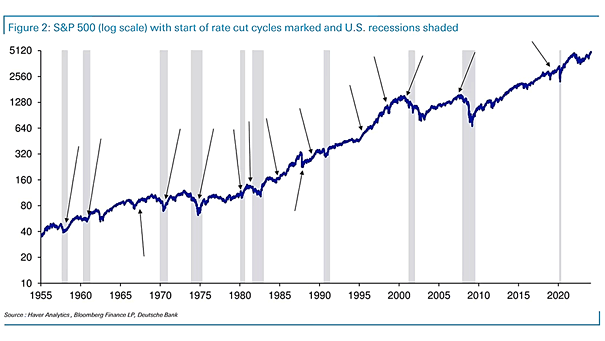
S&P 500 with Start of Rate Cut Cycles and U.S. Recessions Historically, the S&P 500 has tended to post positive returns in the 12 months following the Fed’s first rate cut, unless the U.S. economy enters recession. Image: Deutsche Bank
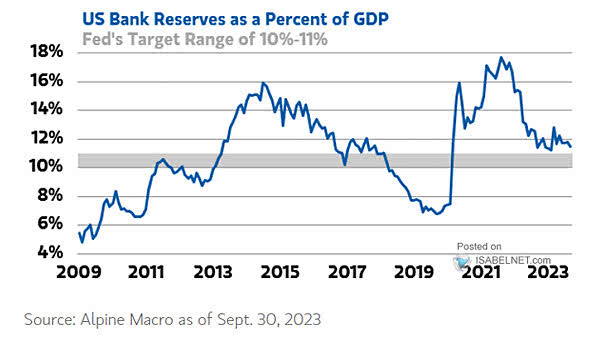
U.S. Bank Reserves as a Percent of GDP As bank reserves relative to GDP gradually return to normal levels, they will no longer contribute to the upward momentum of equity valuation multiples. Image: Morgan Stanley Wealth Management
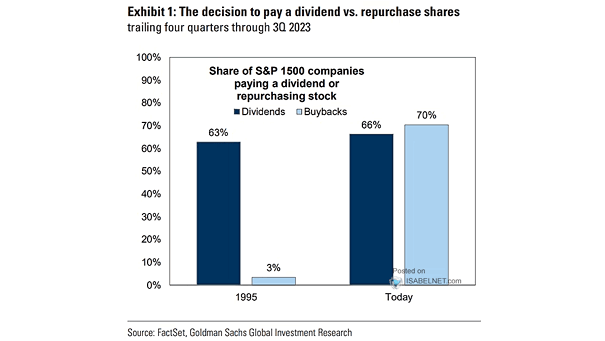
Buybacks – Share of S&P 1500 Companies Paying a Dividend or Repurchasing Stock Over the years, the share of S&P 1500 companies engaging in share repurchases has surged. In 1995, only 3% participated, while in 2023, it reached 70%, greatly enhancing shareholder returns. Image: Goldman Sachs Global Investment Research
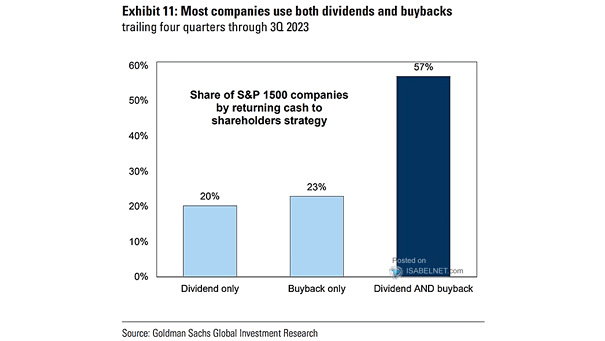
Share of S&P 1500 Companies by Returning Cash to Shareholders Strategy Most S&P 1500 companies are returning cash to shareholders through both dividends and buybacks, which can significantly boost shareholder returns. Image: Goldman Sachs Global Investment Research