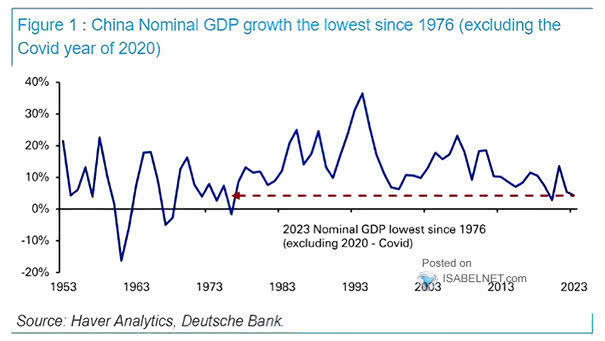
S&P 500 – % Stocks That Are Within 10% of Their All-Time Highs Highs

S&P 500 – % Stocks That Are Within 10% of Their All-Time Highs Highs The S&P 500 is nearing its all-time high, but only 24% of individual stocks are within 10% of their peak levels, raising concerns about market health, as gains are driven by a few large-cap stocks while others struggle to recover. Image:…

VIX and Geopolitical Risk Index

VIX and Geopolitical Risk Index The VIX tends to be sensitive to geopolitical events and can serve as an indicator of market sentiment during times of heightened geopolitical risk. Image: Goldman Sachs Global Investment Research

U.S. Home Price Forecasts

U.S. Home Price Forecasts Morgan Stanley projects a 3% decline in U.S. home prices for 2024. However, their bull case scenario predicts a 5% increase, while the bear case scenario anticipates an 8% drop. Image: Morgan Stanley Research

Market Pricing of Fed Cuts vs. Real 10-Year U.S. Treasury Yield

Market Pricing of Fed Cuts vs. Real 10-Year U.S. Treasury Yield When the market expects the Federal Reserve to cut interest rates, it often leads to lower real yields, as investors adjust their expectations. Image: Goldman Sachs Global Investment Research

EM/DM Relative Performance vs. U.S. Dollar

EM/DM Relative Performance vs. U.S. Dollar The strength of the U.S. dollar can affect the relative performance of EM/DM equities. A weak U.S. dollar has historically led to outperformance of emerging market equities. Image: BofA Global Investment Strategy

S&P 500 and Monthly MACD

S&P 500 and Monthly MACD The overall trend of the S&P 500 is upward, as indicated by the rising 12-month moving average, and the positive signal from the MACD further supports this notion. Image: BofA Global Research

S&P 500 Realized Volatility During Recession

S&P 500 Realized Volatility During Recession During recessions, there is often increased uncertainty and risk aversion among investors, which can lead to higher levels of volatility in the U.S. stock market. Image: BofA Global Research

10-Year U.S. Treasury Yield

10-Year U.S. Treasury Yield U.S. yields are likely to be lower in 2024, which could potentially support a cyclical bull bond market. Image: BofA Global Investment Strategy

U.S. Nominal GDP Less Government Budget Deficit

U.S. Nominal GDP Less Government Budget Deficit While fiscal spending in the United States has the potential to boost GDP growth, it is important to carefully consider the long-term implications and trade-offs associated with such policies. Image: Morgan Stanley Wealth Management

S&P 500 Performance After a New All-Time High After More a Full Year Without One

S&P 500 Performance After a New All-Time High After More a Full Year Without One Historically, when the S&P 500 index has reached new highs following a period of more than a year without achieving such levels, it has seen a significant increase in value of approximately 15% a year later. Image: Carson Investment Research