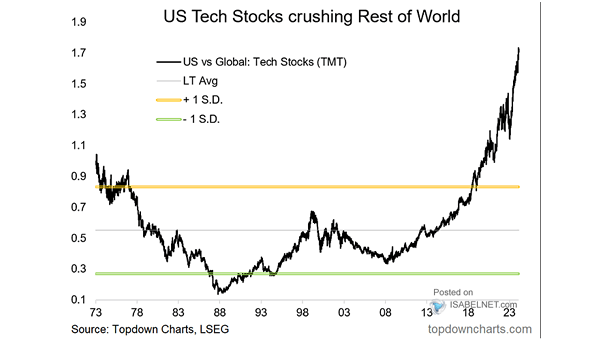
U.S. Tech Stocks vs. Global Tech Stocks

U.S. Tech Stocks vs. Global Tech Stocks The remarkable outperformance of U.S. tech stocks underscores the competitive advantage and innovation prowess of U.S. companies, consistently surpassing global peers in growth and market value. Image: Topdown Charts
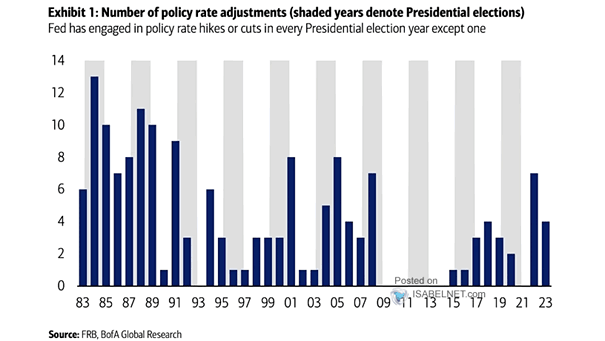
Fed – Number of Policy Rate Adjustments

Fed – Number of Policy Rate Adjustments Throughout history, the Federal Reserve has made decisions that are not influenced by the election cycle, as the central bank’s actions are predominantly guided by economic indicators and its dual mandate. Image: BofA Global Research

Real S&P 500 Index and Periods to Breakeven

Real S&P 500 Index and Periods to Breakeven The timing of your investment journey can significantly impact your future outcomes, and even with the Fed’s interventions, recovering from a bear market can take a considerable amount of time. Image: Real Investment Advice

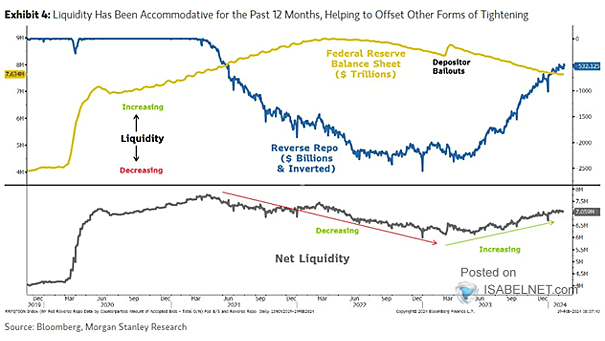
S&P 500 – Change in Liquidity

S&P 500 – Change in Liquidity Will the support given to U.S. equities through the increase in net liquidity since March 2023 persist until the end of the year? Image: Morgan Stanley Research

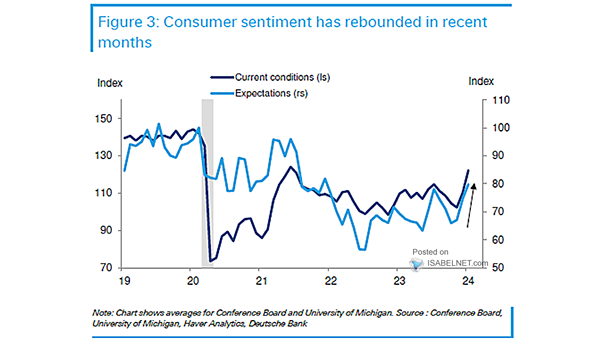
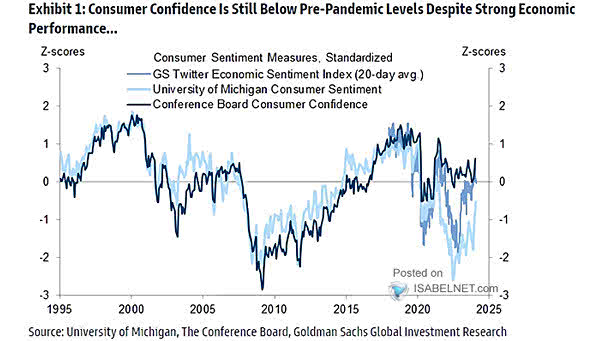
U.S. Consumer Sentiment

U.S. Consumer Sentiment and Recession In recent months, U.S. consumer sentiment has improved markedly, mainly due to lower inflation, the positive performance of risk assets and a recovery in real income growth. Image: Deutsche Bank

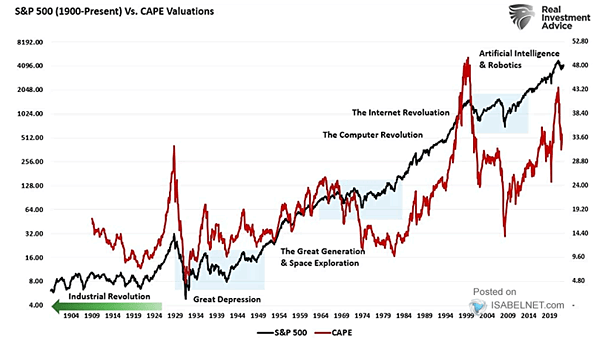
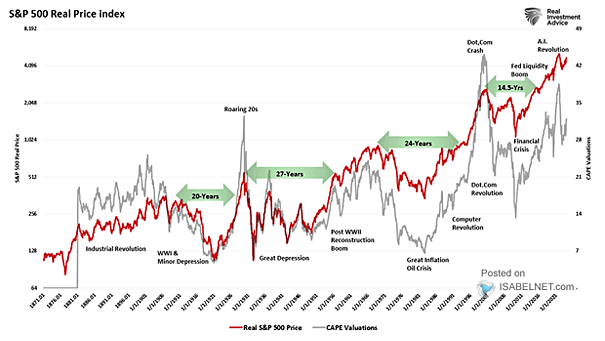
S&P 500 – CAPE Valuations

S&P 500 – CAPE Valuations While a high CAPE ratio can persist for extended periods without triggering a market correction, historical data suggests that such periods of elevated valuations are typically followed by lower stock market returns. Image: Real Investment Advice

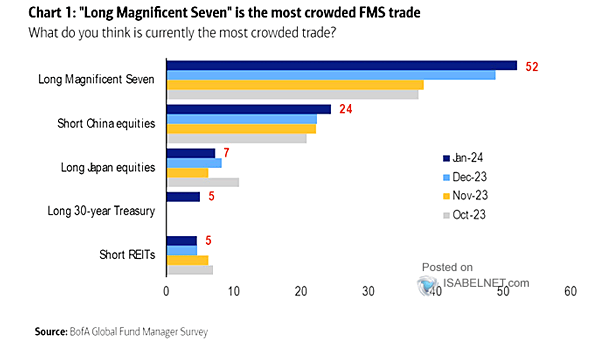
What Do You Think Is Currently the Most Crowded Trade?

What Do You Think Is Currently the Most Crowded Trade? The “Long Magnificent Seven” trade remains widely considered the most crowded trade among FMS investors. The popularity of these stocks may be attributed to their robust performance and dominant position in the market. Image: BofA Global Fund Manager Survey

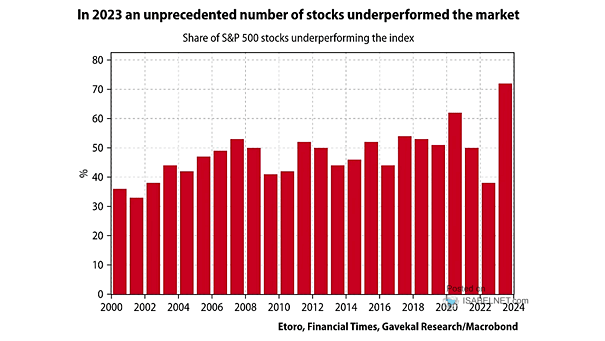
Share of S&P 500 Stocks Underperforming the Index

Share of S&P 500 Stocks Underperforming the Index Despite the strong performance of the S&P 500 index in 2023, more than 70% of the individual stocks within the index underperformed, indicating that the overall gains were driven by a relatively small number of stocks. Image: Gavekal, Macrobond

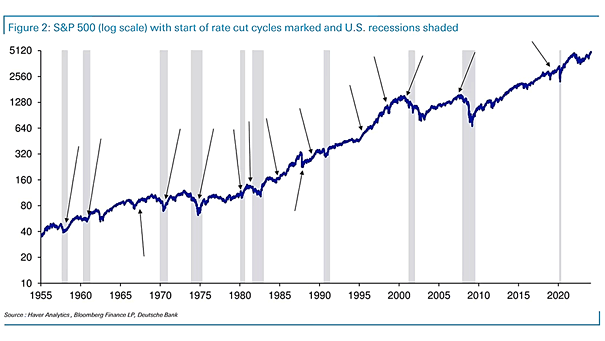
S&P 500 with Start of Rate Cut Cycles and U.S. Recessions

S&P 500 with Start of Rate Cut Cycles and U.S. Recessions Historically, the S&P 500 has tended to post positive returns in the 12 months following the Fed’s first rate cut, unless the U.S. economy enters recession. Image: Deutsche Bank