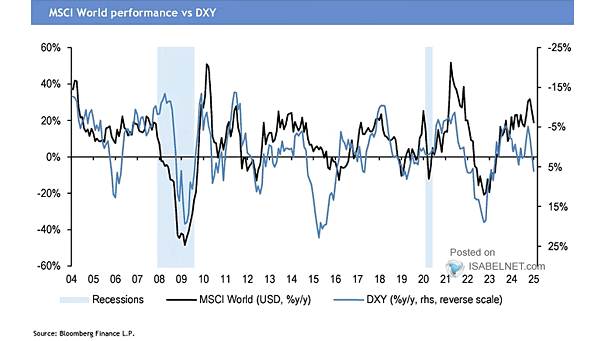
U.S. ETF and Mutual Fund Flows

U.S. ETF and Mutual Fund Flows Investors are exhibiting a strong and sustained appetite for U.S. money market funds, driven by ongoing market volatility and persistently high short-term interest rates. Image: Goldman Sachs Global Investment Research

S&P 500 Drawdown in DXY Dollar Index

S&P 500 Drawdown in DXY Dollar Index The U.S. equity drawdown has caused major losses for non-U.S. investors, as falling stock prices and a weaker dollar combined. This has prompted many to reconsider their currency risk strategies and exposure to U.S. equities. Image: Gavekal, Macrobond

U.S. Current Activity Indicator

U.S. Current Activity Indicator U.S. soft data and growth signals have improved slightly, largely due to a more favorable trade policy outlook following the partial rollback of tariffs. Image: Goldman Sachs Global Investment Research

S&P 500 Performance

S&P 500 Performance The S&P 500 is poised for its best monthly performance since July 2023, marking a significant turnaround and defying the old “sell in May and go away” adage. Image: Bloomberg

S&P 500 Performance After at Least 15 Weeks of AAII Bears over Bulls Ends

S&P 500 Performance After at Least 15 Weeks of AAII Bears over Bulls Ends A streak of 15 consecutive weeks with more bears than bulls in the AAII survey is rare—only four other periods have lasted this long. In each case, the S&P 500 was higher 12 months later, with an average gain of 27.5%.…

Impact of Higher Tariffs on the U.S. Core PCE Price Index

Impact of Higher Tariffs on the U.S. Core PCE Price Index The coming inflation rebound is expected be limited in scope and duration, meaning it is unlikely to trigger the kind of persistent inflation psychology that can drive a sustained wage-price spiral. Image: Goldman Sachs Global Investment Research

Money Market Fund Assets

Money Market Fund Assets While the $7 trillion in money market funds is frequently cited as potential fuel for equities and risk assets, most evidence suggests this cash is primarily a result of yield optimization and prudent cash management. Image: Bloomberg

U.S. Recession Odds

U.S. Recession Odds A Bloomberg survey in May 2025 puts the likelihood of a U.S. downturn in the next year at 40%—a drop from 45% in April, but still considerably higher than the 30% forecast in March. Image: Bloomberg

U.S. 10-Year Treasury Yield and U.S. Federal Debt Held by the Public

U.S. 10-Year Treasury Yield and U.S. Federal Debt Held by the Public Even with U.S. federal debt at historic highs and projected to rise further, the 10-year U.S. Treasury yield remains low compared to the high-inflation periods of the past half-century. Image: Deutsche Bank

Mega-Cap Growth & Tech Positioning

Mega-Cap Growth & Tech Positioning Mega-cap growth and tech stocks’ 21st percentile position signals that investors are de-risking portfolios, shifting away from concentrated bets on high-growth tech leaders in favor of safer, more diversified investments. Image: Deutsche Bank Asset Allocation

Bloomberg Dollar Spot Index

Bloomberg Dollar Spot Index The U.S. dollar’s slump reflects deepening investor worries about U.S. trade and fiscal policies, with the outlook remaining uncertain as markets await further developments in tariff negotiations and fiscal management. Image: Bloomberg