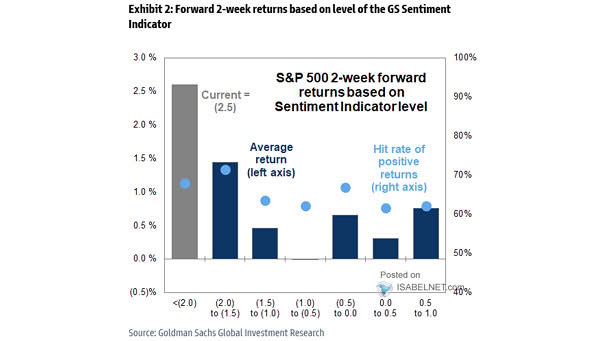
S&P 500 1-Month Forward Returns Based On Sentiment Indicator Level
S&P 500 1-Month Forward Returns Based On Sentiment Indicator Level Goldman Sachs’ U.S. Equity Sentiment Indicator sits at 1.7, a reading historically linked to an average 0.4% decline in the S&P 500 over the next month. Image: Goldman Sachs Global Investment Research