WTI Oil Prices in Real Terms

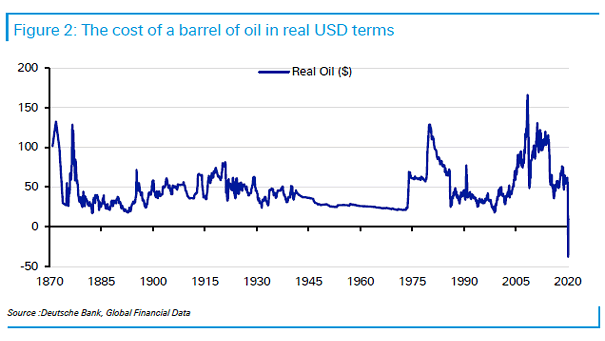
WTI Oil Prices in Real Terms The 2026 oil shock looks far less dramatic in historical terms. It still bites, just not with the same force. Once you adjust for inflation and reduced energy intensity, today’s price levels compare more favourably than in 2022. Image: Deutsche Bank

Central Bank Gold Purchases

Central Bank Gold Purchases Central bank gold buying eased to 863 tonnes in 2025 from 1,092 tonnes in 2024. Buying has cooled, but official-sector demand remains well above historical standards and continues to play a strategic role in reserve diversification. Image: Real Investment Advice

Various S&P 500 Index 6-Month Returns

Various S&P 500 Index 6-Month Returns May-October is often seen as the weaker stretch for U.S. stocks, averaging just 2.1%. But when April rallies more than 5%, history flips the script: since 1950, the S&P 500 has averaged a 6.6% gain, with a median return of 10%. Image: Carson Investment Research

Risky vs. Safe Assets Fund Flows

Risky vs. Safe Assets Fund Flows Over the past four weeks, inflows into risk assets have outpaced those into safer funds, pointing to a shift in investor appetite toward higher-return bets. With confidence rebuilding, markets are tilting back toward risk. Image: Goldman Sachs Global Investment Research

Hyperscaler Quarterly Capex Growth

Hyperscaler Quarterly Capex Growth Over the next few quarters, hyperscalers are set to slow capex growth, which could drag on valuations while leaving them more vulnerable in the supply-strained battle for AI leadership. Image: Goldman Sachs Global Investment Research

S&P 500 Average Monthly Returns Since 1950

S&P 500 Average Monthly Returns Since 1950 Since 1950, May has been a dead spot for U.S. stocks. The market typically finds its footing in June and July, only to see momentum fade as August and September drag returns lower. Image: Real Investment Advice

Discretionary Positioning and Ex-MCG & Tech Earnings Growth

Discretionary Positioning and Ex-MCG & Tech Earnings Growth Discretionary positioning continues to lag earnings growth beyond MCG and Tech, leaving upside on the table if revisions hold and macro risks stay in check. Image: Deutsche Bank Asset Allocation

Typical Path of S&P 500 Bottom-Up Consensus EPS Estimate

Typical Path of S&P 500 Bottom-Up Consensus EPS Estimate Analysts usually trim EPS estimates in the first four months of the year. Not this time. In 2026, revisions are heading higher, fueled by AI optimism and backed by confident management guidance. Image: Goldman Sachs Global Investment Research

Equity Sector Flows

Equity Sector Flows Money continues to pour into industrials, energy and materials, underscoring the ongoing tilt toward cyclical plays. Image: J.P. Morgan Equity Derivatives Strategy