PMI vs. Equity Risk Premium
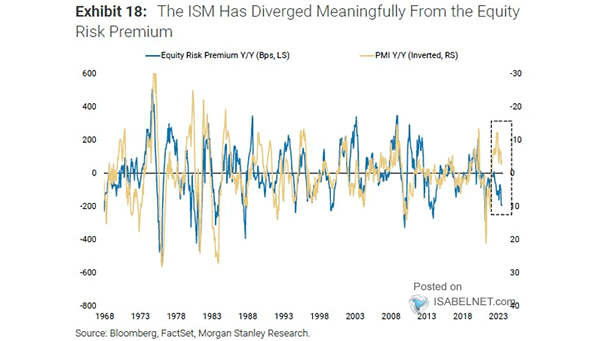
PMI vs. Equity Risk Premium The divergence between the ISM PMI and the equity risk premium is significant. Image: Morgan Stanley Research
PMI vs. Equity Risk Premium The divergence between the ISM PMI and the equity risk premium is significant. Image: Morgan Stanley Research
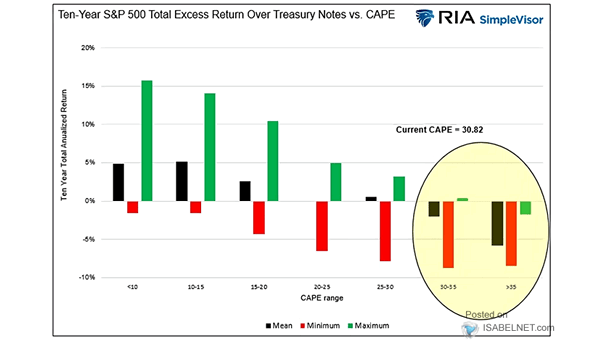
10-Year S&P 500 Total Excess Return Over U.S. Treasury Notes vs. CAPE When CAPE valuations exceed 30, long-term buy-and-hold investors can generally benefit more from purchasing 10-year U.S. Treasury bonds than U.S. stocks. Image: Real Investment Advice
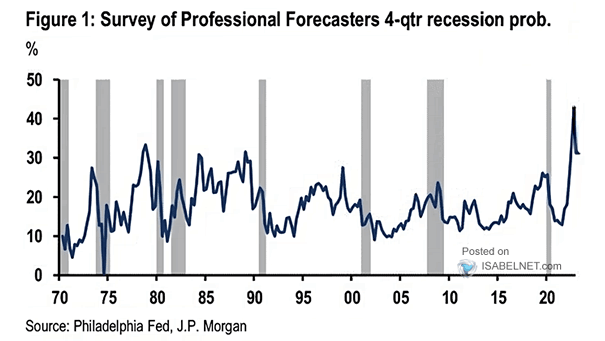
Professional Forecasters Probability of Recession U.S. recession fears among professional forecasters remain elevated. Image: Goldman Sachs Global Investment Research
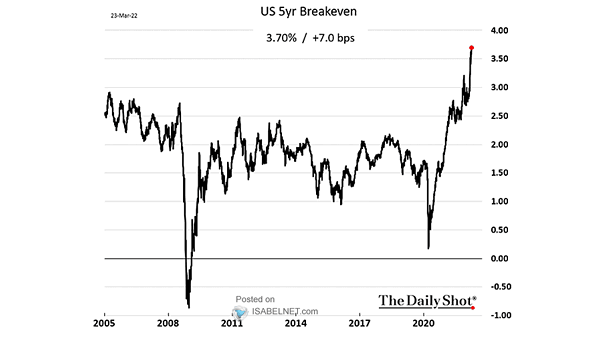
Inflation – U.S. 5-Year, 5-Year Forward Breakeven Rate U.S. bond market expectations for inflation are rising again, which is not good news. Image: The Daily Shot
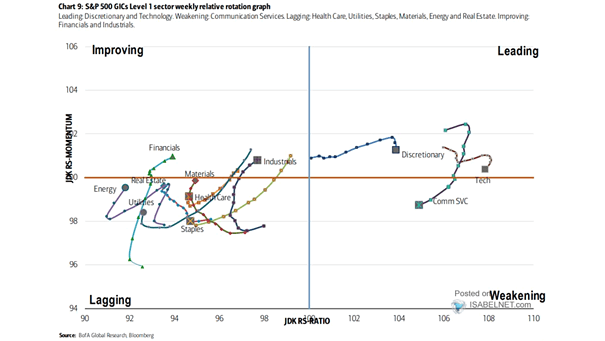
S&P 500 GICs Level 1 Sector Weekly Relative Rotation Graph Will technology and discretionary stocks continue to lead? Image= BofA Global Research
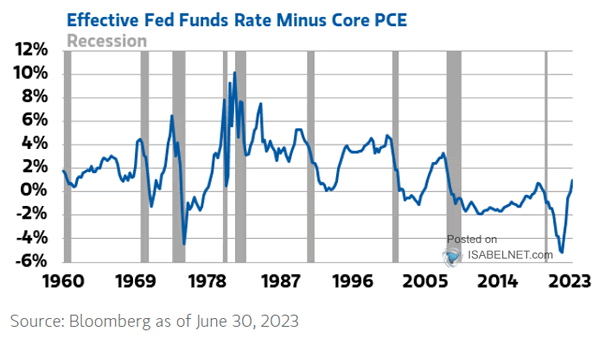
Fed Funds Rate Less U.S. Core PCE Is the Federal Reserve’s monetary policy really restrictive in order to return inflation to 2%? Image: Morgan Stanley Wealth Management
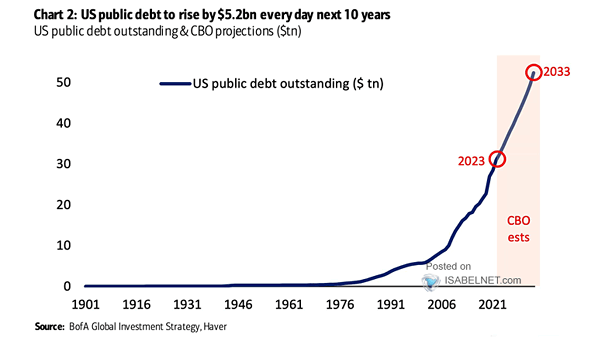
U.S. Public Debt Outstanding The U.S. public debt is projected to continue growing by $5.2 billion every day over the next 10 years. Image: BofA Global Investment Strategy
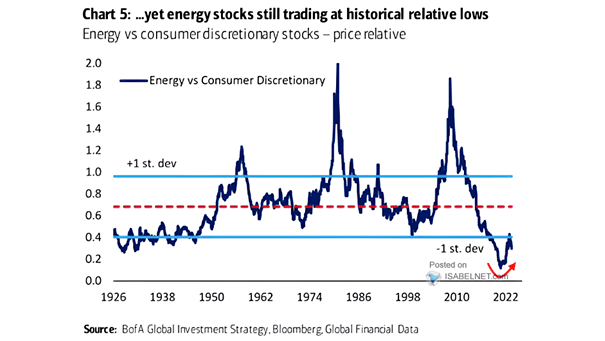
Energy vs. Consumer Discretionary Stocks Should investors remain long energy stocks? Image: BofA Global Investment Strategy
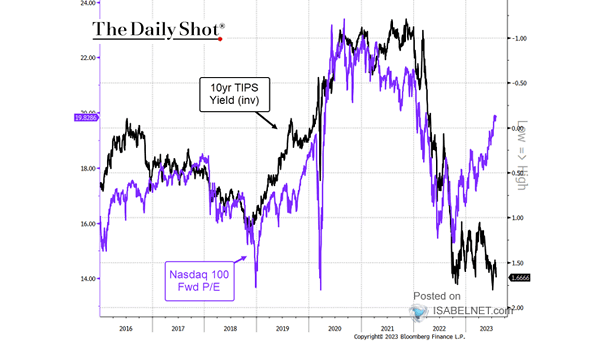
Nasdaq 100 vs. 10-Year U.S. TIPS Yield (Inverted) The Nasdaq 100 has shown strong performance despite the rise in real yields, which may indicate the possibility of the market overheating. Image: The Daily Shot
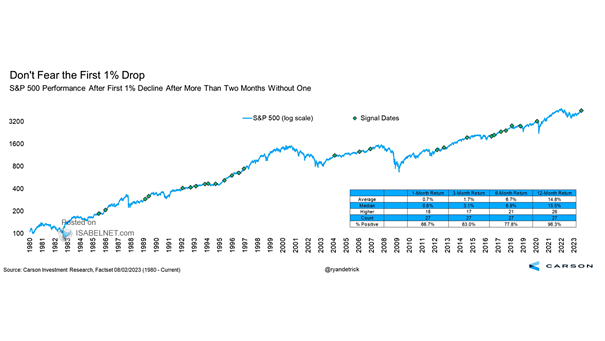
S&P 500 Performance After First 1% Decline After More Than Two Months Without One Why U.S. equity investors should not fear the first 1% drop following more than two months without one? Because the S&P 500 has gained 14.8% on average one year later since 1980. Image: Carson Investment Research
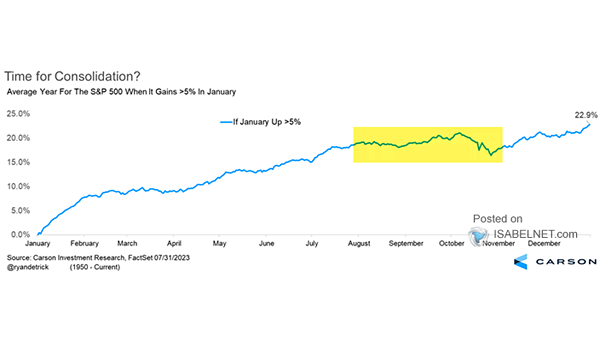
Average Year for the S&P 500 when It Gains >5% in January Historically, U.S. stocks may experience weakness over the coming months. Image: Carson Investment Research