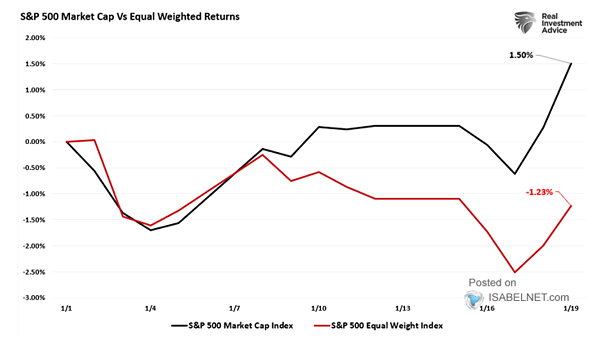
S&P 500 Index and Technical Score

S&P 500 Index and Technical Score With a reading of 88.49, the S&P 500 is still considered overbought—typically a sign of heightened buying activity and limited upside potential. Image: Real Investment Advice

S&P 500 Performance After >25% Rally in 100 Trading Days (Since 1950)

S&P 500 Performance After >25% Rally in 100 Trading Days (Since 1950) Good news for bulls: since April’s low, the S&P 500 has risen over 25% in 100 trading days—a rare event. Historically since 1950, such rises have delivered positive 12-month returns 90.9% of the time, with a median gain of 13.2%. Image: Carson Investment…

ISM Manufacturing Index vs. S&P 500 Index

ISM Manufacturing Index vs. S&P 500 Index The U.S. ISM Manufacturing Index in August stands at 48.7%, below the consensus forecast of 49.0%, which is indicative of a contraction in the manufacturing sector. This chart shows the correlation between the U.S. ISM manufacturing index and the S&P 500 index year-over-year percent change, since 2011. Click…

S&P 500 2026 Target

S&P 500 2026 Target Driven by enthusiasm for artificial intelligence, Evercore ISI forecasts the S&P 500 will rise to 7,750 points by the end of 2026, marking a 20% gain from current levels. Image: Bloomberg

S&P 500 Annualized 1-Month Volatility

S&P 500 Annualized 1-Month Volatility In this post-election year, the current period indicates increased volatility ahead for U.S. stocks, reinforcing the need for cautious risk management during this sensitive stage of the cycle. Image: Nautilus Research

U.S. Fund Flows

U.S. Fund Flows Since 2023, cash and bonds have attracted substantial inflows, driven by central bank policy shifts, investor preferences for income and safety, and broader macroeconomic factors. Image: Goldman Sachs Global Investment Research

New York Fed GDP Nowcast

New York Fed GDP Nowcast The New York Fed has revised its Q3 2025 real GDP Nowcast upward to 2.22%, from 2.01% last week, reflecting ongoing expansion though at a moderate pace. Image: Federal Reserve Bank of New York Click the Image to Enlarge

Bond Seasonality – Monthly Median Return on Global 10y+ Goverment Bonds

Bond Seasonality – Monthly Median Return on Global 10y+ Goverment Bonds Long-term government bonds globally face a challenging September due to seasonality and ongoing geopolitical and economic uncertainties, reinforcing historical trends of September being their worst-performing month annually. Image: Bloomberg

AAII Investor Sentiment Bull Minus Bear Spread

AAII Investor Sentiment Bull Minus Bear Spread The AAII bull-minus-bear spread, indicating strong pessimism among U.S. retail investors who expect stock prices to decline in the near term, is widely seen as a contrarian bullish indicator. Image: J.P. Morgan

Investor Sentiment – U.S. Market Greed/Fear Index

Investor Sentiment – U.S. Market Greed/Fear Index The Market Greed/Fear Index, with a reading of 75.52, shows that investor sentiment is nearing extreme greed, a level elevated enough to warrant some risk management. Image: Real Investment Advice