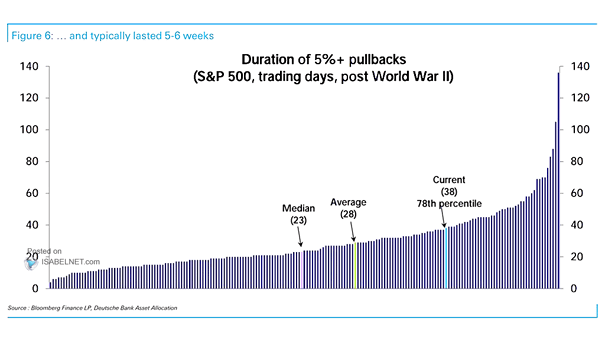
S&P 500 – Duration of 5%+ Pullbacks
S&P 500 – Duration of 5%+ Pullbacks Typically, S&P 500 pullbacks of 5% or more tend to persist for an average of 28 days. Image: Deutsche Bank Asset Allocation
S&P 500 – Duration of 5%+ Pullbacks Typically, S&P 500 pullbacks of 5% or more tend to persist for an average of 28 days. Image: Deutsche Bank Asset Allocation
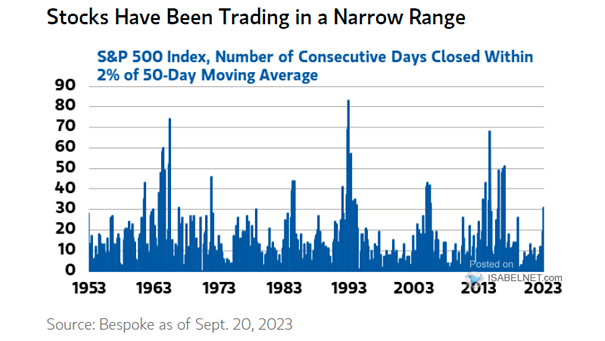
S&P 500 Index, Number of Consecutive Days Closed Within 2% of 50-Day Moving Average When the S&P 500 index trades in a narrow range and stays close to the 50-day moving average for an extended period of time, it can indicate indecision or a lack of a clear trend in the market. Image: Morgan Stanley…
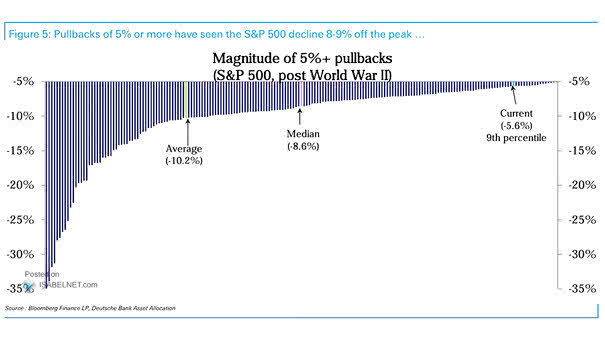
S&P 500 – Magnitude of 5%+ Pullbacks When pullbacks of 5% or more occur, historical data shows that the S&P 500 has experienced an average decline of -10.2% from its peak. Image: Deutsche Bank Asset Allocation
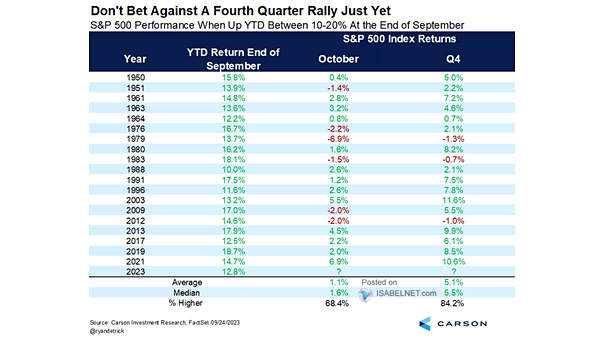
S&P 500 Performance When Up YTD Between 10-20% At the End of September When the S&P 500 is up year-to-date between 10-20% at the end of September, the fourth quarter tends to be bullish. Historical trends are not a guarantee of future performance, but they can provide useful insights for investors and traders when making…
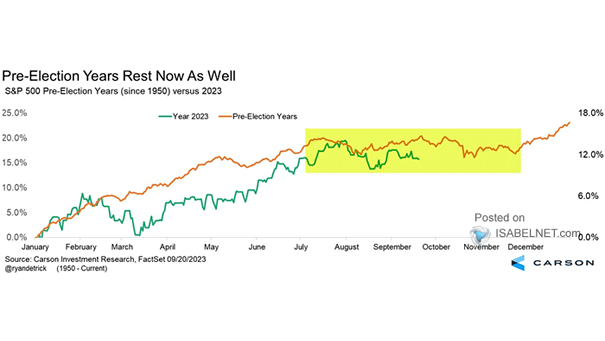
Average Year for the S&P 500 During a Pre-Election Year Historically, the third quarter of pre-election years has been characterized by weakness in the performance of the S&P 500, while the fourth quarter has exhibited strength. Image: Carson Investment Research
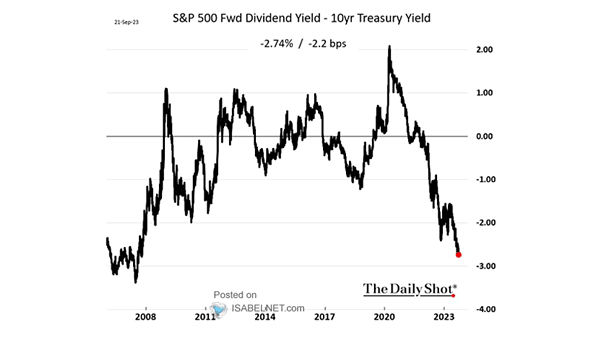
S&P 500 Dividend Yield and 10-Year Treasury Yield U.S. Treasuries may currently appear attractive compared to the S&P 500 dividend yield. Image: The Daily Shot
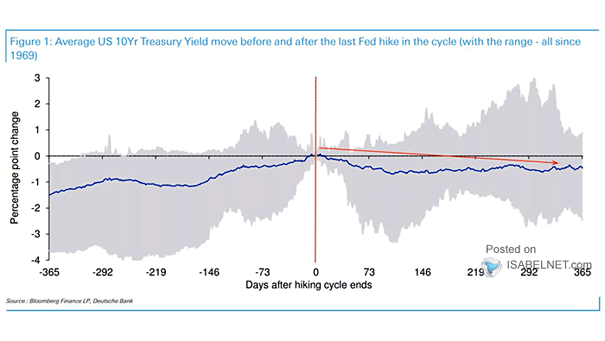
Average U.S. 10-Year Treasury Yield Move Before and After the Last Fed Hike in the Cycle Historically, after the last Fed rate hike, U.S. 10-year Treasury yields have tended to trend lower on average. Image: Deutsche Bank
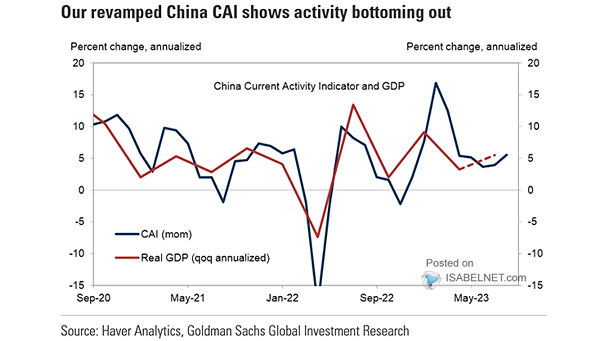
China Real GDP Growth Forecast The downturn in growth in China may be stabilizing. Image: Goldman Sachs Global Investment Research
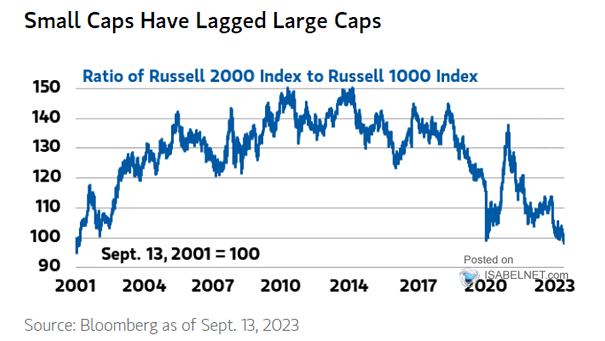
Performance – Ratio of Russell 2000 Index to Russell 1000 Index The underperformance of small caps relative to large caps raises questions about their capacity to adapt to rapid changes in the economic landscape. Image: Morgan Stanley Wealth Management
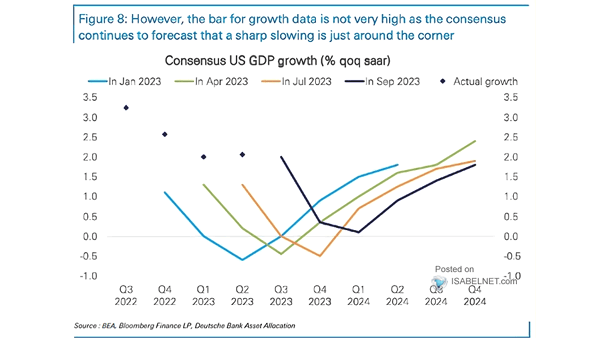
Consensus U.S. GDP Growth Could the United States experience a significant deceleration in GDP growth in the near future? Image: Deutsche Bank Asset Allocation
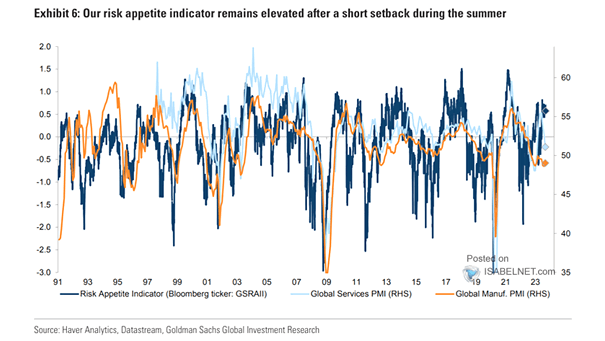
Sentiment – Global PMI and Risk Appetite Indicator The GS risk appetite indicator remaining elevated suggests that investors have a high appetite for risk in the financial markets. Image: Goldman Sachs Global Investment Research