S&P 500 Performance and Risk Appetite Indicator
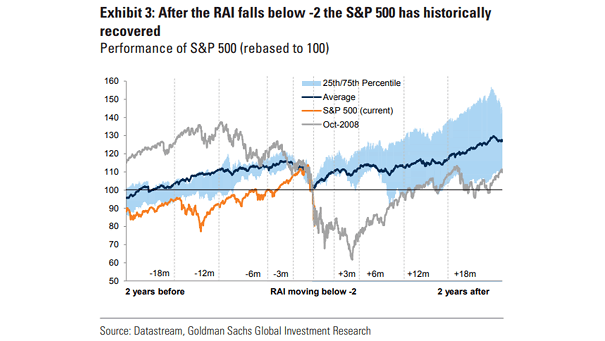
S&P 500 Performance and Risk Appetite Indicator Good news for the bulls: Goldman Sachs’s Risk Appetite Indicator broke above 1.0 last week, a bullish signal that has historically lined up with roughly 15% median gains in the S&P 500 over the next 12 months. Image: Goldman Sachs Global Investment Research