Beta Exposure of Large Cap U.S. Active Managers vs. S&P 500
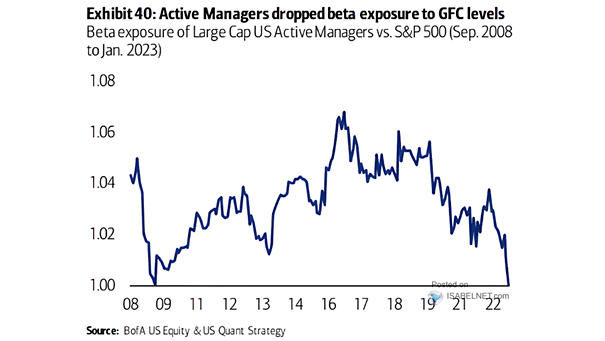
Beta Exposure of Large Cap U.S. Active Managers vs. S&P 500 Among active managers, there is a significant drop in beta exposure to GFC levels. Image: BofA US Equity & Quant Strategy
Beta Exposure of Large Cap U.S. Active Managers vs. S&P 500 Among active managers, there is a significant drop in beta exposure to GFC levels. Image: BofA US Equity & Quant Strategy
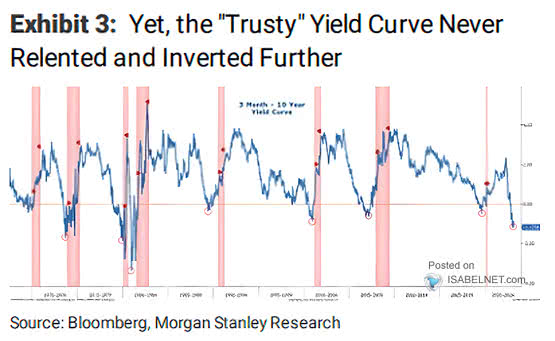
U.S. 10Y-3M Yield Curve The U.S. 10Y-3M yield curve suggests that the U.S. economy may be headed for a downturn in the near future. Image: Morgan Stanley Research
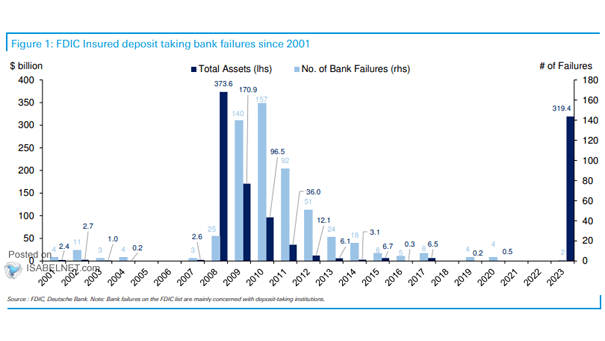
FDIC Insured Deposit Taking Bank Failures There have been hundreds of bank failures in the United States over the past two decades, which can have significant consequences for individuals and organizations. Image: Deutsche Bank
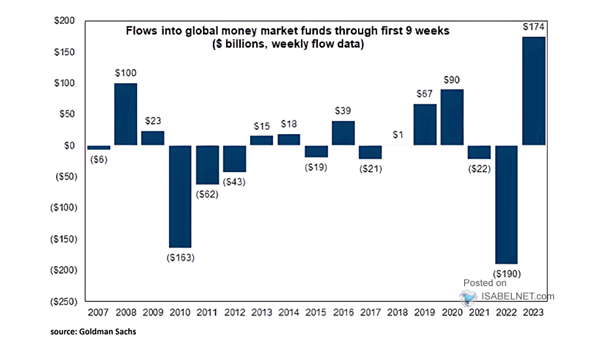
Flows into Global Money Market Funds There were significant flows into global money market funds in the first 9 weeks, as rate rises. Image: Goldman Sachs Global Investment Research
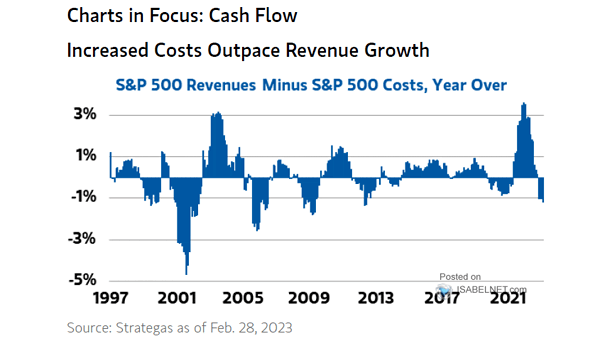
S&P 500 Revenues Minus S&P 500 Costs Increased costs have outpaced S&P 500 revenue growth, which is not good news. Image: Morgan Stanley Wealth Management
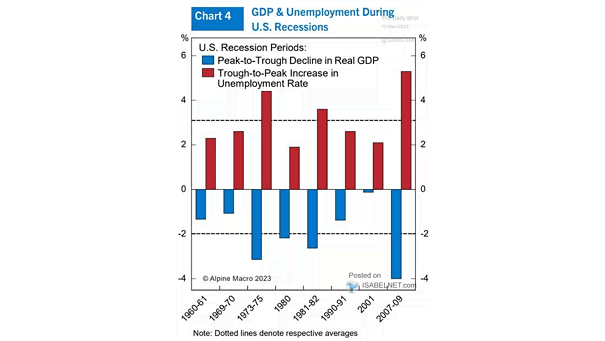
GDP and Unemployment During U.S. Recessions The severity of a U.S. recession can be measured by the duration and magnitude of the increase in unemployment rate and the decline in real GDP. Image: Alpine Macro
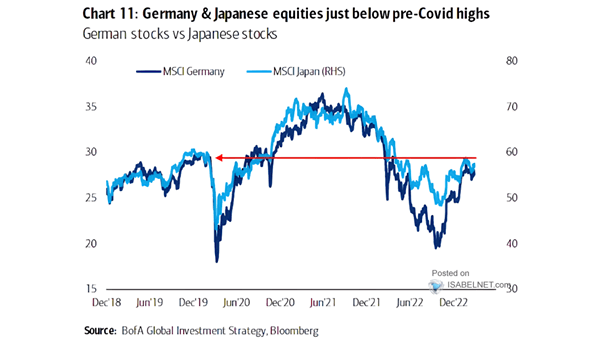
German Stocks vs. Japanese Stocks Germany and Japanese equities remain below pre-COVID highs. Image: BofA Global Investment Strategy
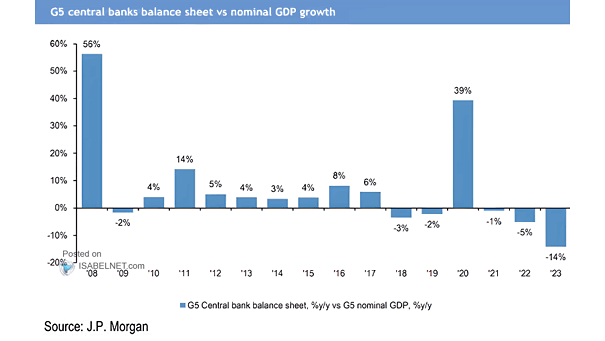
G5 Central Banks Balance Sheet vs. Nominal GDP Growth Shrinking global excess liquidity tends to be a headwind for equity markets. Image: J.P. Morgan
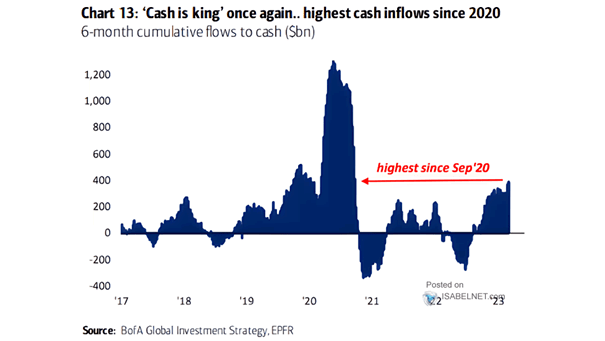
Cash Flows Will flows into cash continue to be strong as rates rise? Image: BofA Global Investment Strategy
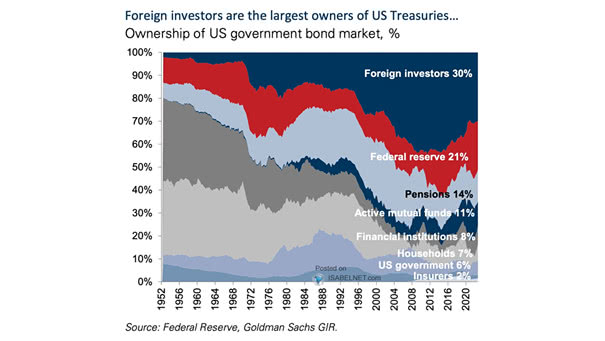
Ownership of U.S. Government Bond Market Foreign investors remain the larger owners of U.S. Treasuries. Image: Goldman Sachs Global Investment Research
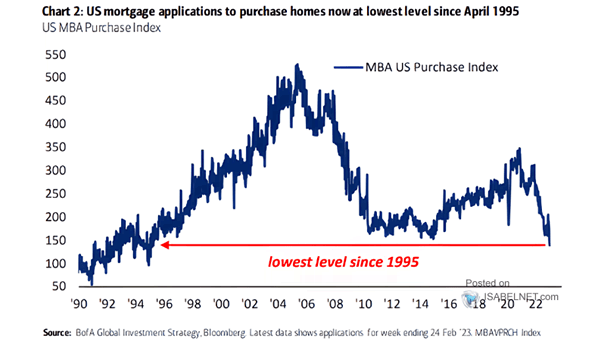
Housing Market – U.S. MBA Purchase Index Mortgage applications are on a downward trend as mortgage rates rise, which is a major factor in the slowdown in the U.S. housing market. Image: BofA Global Investment Strategy