S&P 500 Forward EPS vs. S&P 500
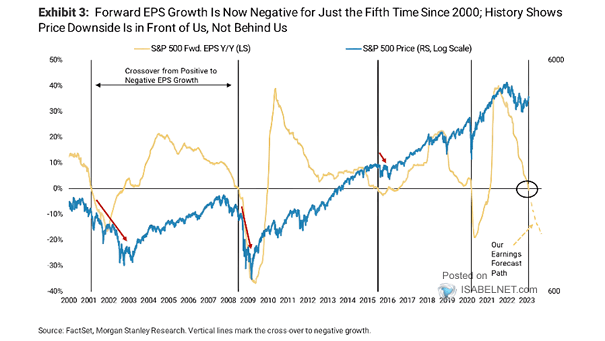
S&P 500 Forward EPS vs. S&P 500 Is there further downside ahead for the S&P 500, as an earnings recession is not priced into U.S. equities? Image: Morgan Stanley Research
S&P 500 Forward EPS vs. S&P 500 Is there further downside ahead for the S&P 500, as an earnings recession is not priced into U.S. equities? Image: Morgan Stanley Research
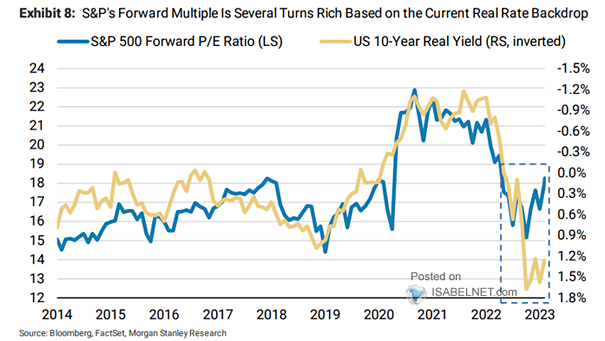
Valuation – 10-Year U.S. Treasury Real Yield vs. S&P 500 Forward Price/Earnings Ratio Despite higher real rates, the S&P 500’s valuation remains elevated. Image: Morgan Stanley Wealth Management
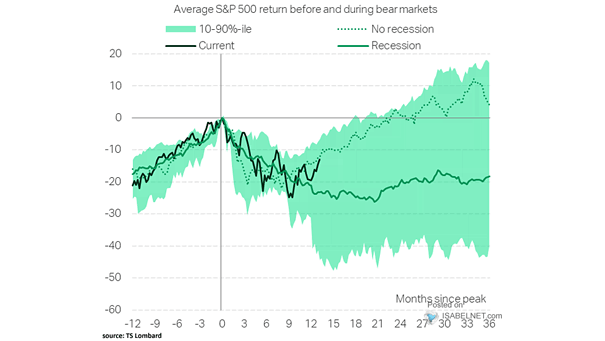
Average S&P 500 Return Before and During Bear Markets The S&P 500 does not price in a U.S. recession. Image: TS Lombard
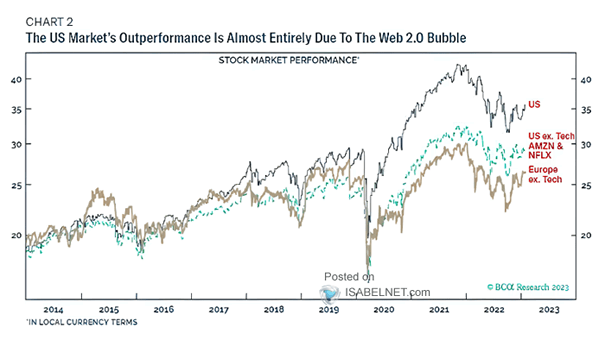
Stock Market Performance Is it the end of the web 2.0 bubble? Image: BCA Research
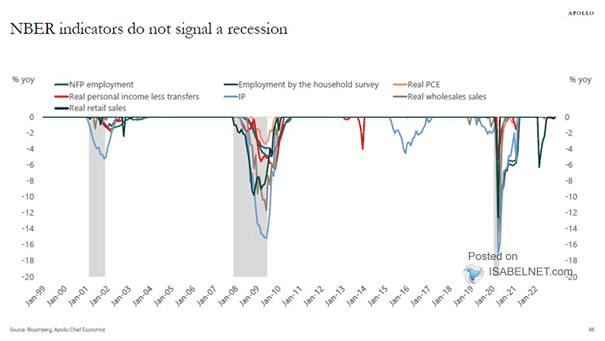
U.S. Recession – NBER Indicators The NBER indicators do not suggest that the U.S. economy is in recession at this time. Image: Apollo Global Management
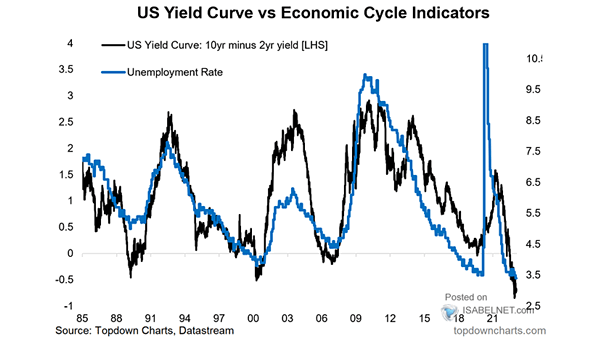
U.S. Unemployment Rate vs. U.S. 10Y-2Y Yield Curve A steepening U.S. yield curve has preceded recessions. Will the U.S. unemployment rate start to rise by the end of 2023? Image: Topdown Charts
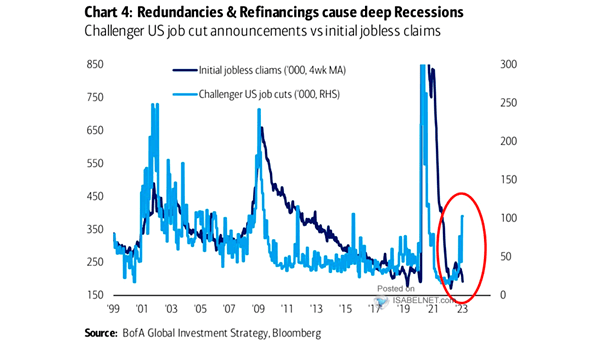
U.S. Labor Market – Challenger U.S. Job Cut Announcements vs. Initial Jobless Claims U.S. job cuts are rising. Does it look like a soft landing at first? Image: BofA Global Investment Strategy
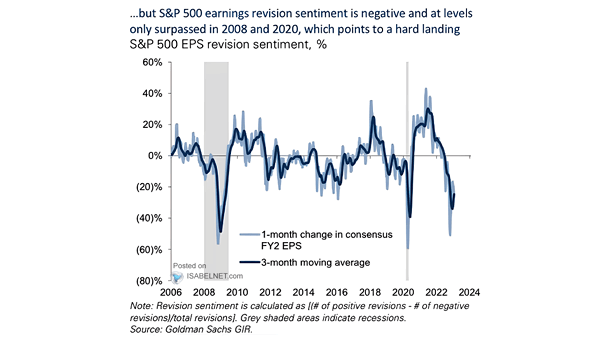
S&P 500 EPS Revisions Sentiment S&P 500 earnings revision sentiment is currently pointing to a hard landing. Could the market experience a downturn in the near future? Image: Goldman Sachs Global Investment Research
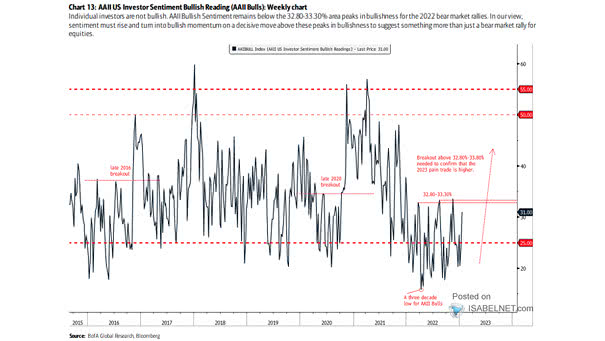
AAII Bullish Sentiment Individual investor sentiment must improve significantly if the current uptrend in U.S. stock prices is more than just a typical bear market rally. Image: BofA Global Research
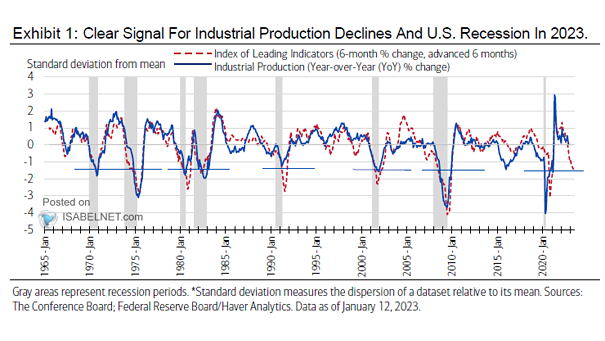
Index of Leading Indicators vs. Industrial Production A further deterioration in U.S. industrial production seems very likely. Image: Merrill Lynch Wealth Management
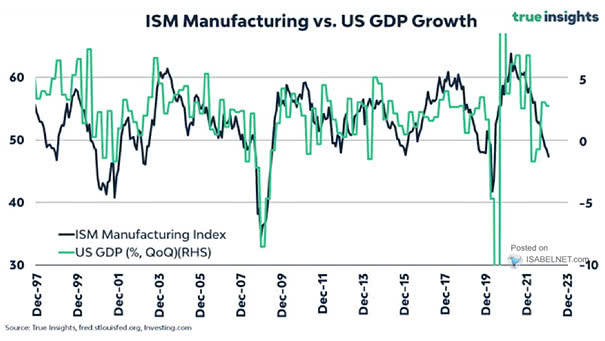
U.S. ISM Manufacturing Index vs. U.S. GDP Growth The current reading of the U.S. ISM Manufacturing Index could result in negative U.S. GDP growth. Image: True Insights