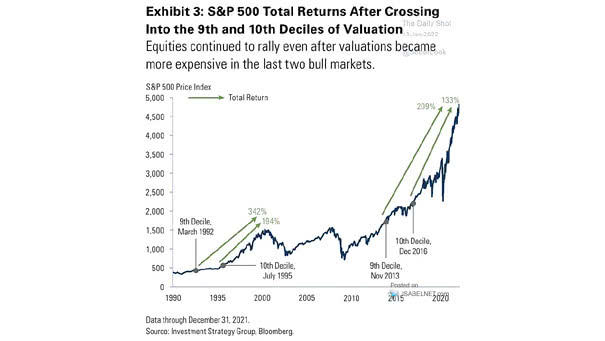
Brent Crude Oil Price Forecast

Brent Crude Oil Price Forecast Goldman Sachs projects that Brent crude oil prices will average $66 per barrel in the second half of 2025, with a subsequent decline to an annual average of $56 per barrel in 2026, as a result of rising global supply from OPEC+. Image: Goldman Sachs Global Investment Research

Monthly Number of U.S. IPOs and S&P 500

Monthly Number of U.S. IPOs and S&P 500 The IPO market’s rebound in 2025 is a clear signal of renewed risk appetite and a progressing market cycle, with investors showing strong demand for new equity issues. Image: Topdown Charts

Inflation – U.S. CPI Deviation from Consensus

Inflation – U.S. CPI Deviation from Consensus A series of lower-than-expected inflation readings gives the administration greater economic leeway to pursue higher tariffs, driven by the (possibly mistaken) belief that U.S. consumers will be largely insulated from their effects. Image: Deutsche Bank

Volatility – U.S. Options Expiration

Volatility – U.S. Options Expiration As $2.8 trillion in options notional value expires, markets may experience greater volatility and price movements due to intensified trading, evolving trader sentiment, and the dynamics of option exercise and settlement. Image: Goldman Sachs Global Investment Research

S&P 500 – Share of Sales Derived from Outside United States

S&P 500 – Share of Sales Derived from Outside United States The “Magnificent Seven” tech giants are more exposed to global trade risks than the rest of the S&P 500, as 49% of their revenue comes from foreign sales. Image: Goldman Sachs Global Investment Research

S&P 500 Options: % of S&P 500 Listed Volume Expiring within 24 Hours

S&P 500 Options: % of S&P 500 Listed Volume Expiring within 24 Hours Trading activity in ultra-short-term S&P 500 options—those expiring within 24 hours—has soared to record highs as investors pursue quick profits, fueling increased market volatility. Image: Goldman Sachs Global Investment Research

Changes in Financial Conditions

Changes in Financial Conditions Looser U.S. financial conditions over the past three months are poised to reinforce two central pillars of economic growth: consumer spending and business investment. This is likely to benefit the U.S. stock market. Image: Goldman Sachs Global Investment Research

S&P 500 – Cumulative Total % Return of the Top 10 U.S. Companies

S&P 500 – Cumulative Total % Return of the Top 10 U.S. Companies Since 2000, maintaining dominance and consistently beating the S&P 500 has eluded almost all top-ten stocks except for rare cases like Microsoft. Current market leaders could defy history, but past evidence suggests it’s a high bar. Image: Deutsche Bank

S&P 500 and Liquidity

S&P 500 and Liquidity Increased aggregate U.S. liquidity generally acts as a tailwind for the stock market, potentially boosting equity prices—a dynamic currently reflected in the Liquidity Index. Image: Real Investment Advice

S&P 500 Index Returns in July

S&P 500 Index Returns in July Historically, the U.S. stock market tends to peak around this time in July. Given both seasonal and technical patterns, it would be perfectly normal for the current powerful 26% rally off the April lows to take a pause. Image: Carson Investment Research

S&P 500 Cycle Composite

S&P 500 Cycle Composite The S&P 500 Cycle Composite points to a less bullish period of the year, with 2025 so far following typical seasonal patterns: early strength, mid-year volatility, and a potential year-end rally. Image: Ned Davis Research