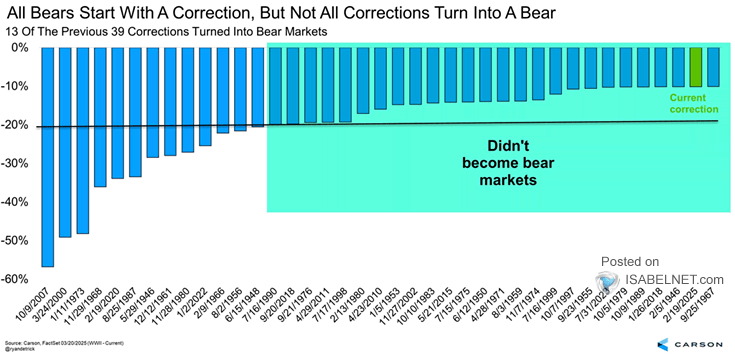
U.S. Dollar Index
U.S. Dollar Index The U.S. dollar index slipping back below its 200-day moving average gives bears more reason to cheer, as the recent rebound loses momentum and the broader downtrend reasserts itself. Image: The Daily Shot
S&P 500 Forward Returns After Extreme AAII Bearish Sentiment Peaks Since 1990, when the AAII bearish sentiment exceeded 45%, as it did recently, the S&P 500 has delivered strong 12‑month gains, averaging more than 18%. Once again, the market looks ready to climb just when investors least expect it. Image: Real Investment Advice
S&P 500 Up 7 Days in a Row and Up >7% After seven straight days of gains and a jump of more than 7%, history points to more good news ahead: median six‑month gains of 18.2% have followed similar streaks since 1950, putting a smile on bulls’ faces. Image: Carson Investment Research
Gold Futures Positioning Despite the drop in gold prices in March, futures positioning held steady, suggesting that investors were buying downside protection rather than making a strong directional bet. Image: Deutsche Bank Asset Allocation
Evolution of S&P 500 Consensus Earnings Optimism is building on Wall Street. Analysts have lifted their S&P 500 bottom-up earnings forecasts for Q2 2026, betting on stronger corporate profit momentum through the year. It’s encouraging to see sentiment turning more positive. Image: Deutsche Bank Asset Allocation
Impact of U.S. Quarter-Over-Quarter Annualized GDP Growth The boost from the 2025 fiscal bill may be short-lived, as the conflict in the Middle East drives oil prices higher and curbs U.S. growth prospects. Image: Goldman Sachs Global Investment Research
S&P 500 Average Return After Recapturing 200-Day Moving Average From Below History favors the bulls: when the S&P 500 has dropped below and regained its 200‑day moving average since 2000, it has averaged a 15% rally in the following 12 months. History doesn’t repeat itself, but it often rhymes. Image: Real Investment Advice
S&P 500 Index Returns In April Even with the Middle East conflict clouding the seasonal backdrop, April has historically been a strong month for U.S. equities, averaging positive returns since 1950. Image: Carson Investment Research
Equity Positioning and S&P 500 EPS Growth Equity positioning is bracing for a sharp earnings slowdown, but recent data are undermining that story. If the gloom fades, risk appetite may rebound fast and lift stocks. Image: Deutsche Bank Asset Allocation
Volatility – VIX Index The VIX dropping below 20 signals fading market jitters and a steadier tone, typically a tailwind for equities as calmer volatility expectations often accompany rising stock prices. Lower volatility tends to invite buyers back in. Image: MarketDesk Research
S&P 500 Performance After 6-Day Win Streaks and Up 6% Six days up in a row and a 6% surge: history says that combo often bodes well for U.S. stocks, with median 12-month gains of 18% since 1950, enough to keep the bulls smiling. Image: Carson Investment Research