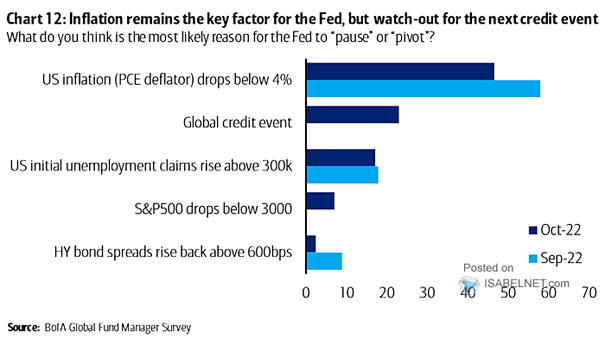
FMS Investors – What Do You Think Is the Most Likely Reason for the Fed to “Pause” or “Pivot”?
FMS Investors – What Do You Think Is the Most Likely Reason for the Fed to “Pause” or “Pivot”? Will the Fed pause if U.S. inflation (PCE deflator) drops below 4%? Image: BofA Global Fund Manager Survey